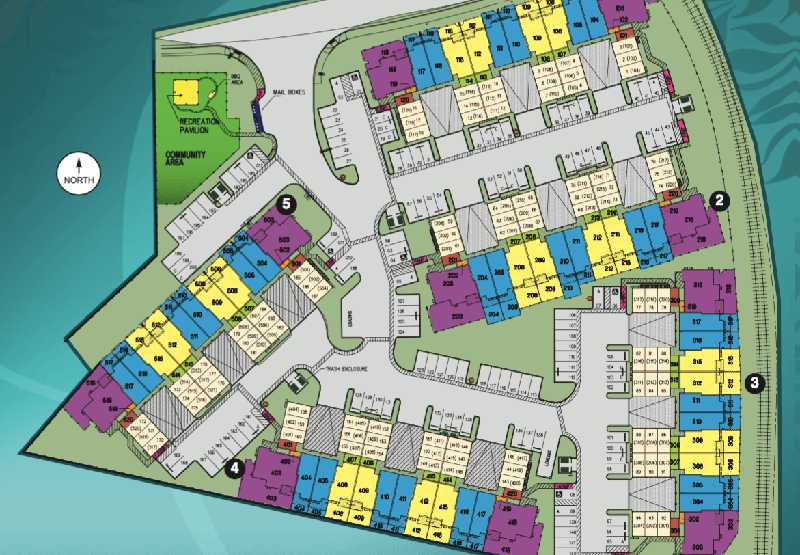
As part of my commitment to keeping the community informed about West Maui’s micro-market real estate environment, I’m bringing you an up-to-date, comprehensive property market summary of Hoonanea at Lahaina, West Maui’s premier local townhome community.
What You’ll Find
- Actual Sales Prices: learn exactly how much specific properties sold for
- Sales Volume: see the strength of the market in terms of how many properties sold
- Days on Market: understand how long it takes the average property to sell
- List Price vs. Sold Price: see how the final sales price compares to the listing price
- Price Per Square Foot: which is critical in calculating real estate values
- Asset % Growth: what is the year over year appreciation of my property
- Current Inventory: what is actively for sale and currently under contract
Before we dig into the numbers, make sure you subscribe to my blog if you want to be notified of future market reports as they come available.

Hoonanea at Lahaina 2019 Headlines (What You Need to Know)
- 5 total sales in 2019 (-58%)
- While there has been a volume slowdown, prices/demand are still strong indicated by another calendar year of positive growth (+3).
- Since 2014, sale prices have increased 40% with relatively equal gains in both 2-bedroom and 3-bedroom units.
- Square footage matters as 1,261 sq ft, 2-Bedroom Malino model sales prices have exceeded last year’s 3-Bedroom sales average ($563K avg vs $558K)
- However, with increased prices (not to mention Bypass traffic congestion) has come a bit of Buyer’s resistance in 2019. This is shown mainly by the decrease in sales volume. In a neighborhood that has historically averaged 9 transactions per yer, there were only 5 in 2019 and 4 other listings cancelled or expired without re-listing.
- Another key indicator is the increased days on market of time to sell. From a 2015 – 2017 it took Hoonanea an average of only 86 days per sale. 2018 – it increased to 118 days and 2019 saw 139 days.
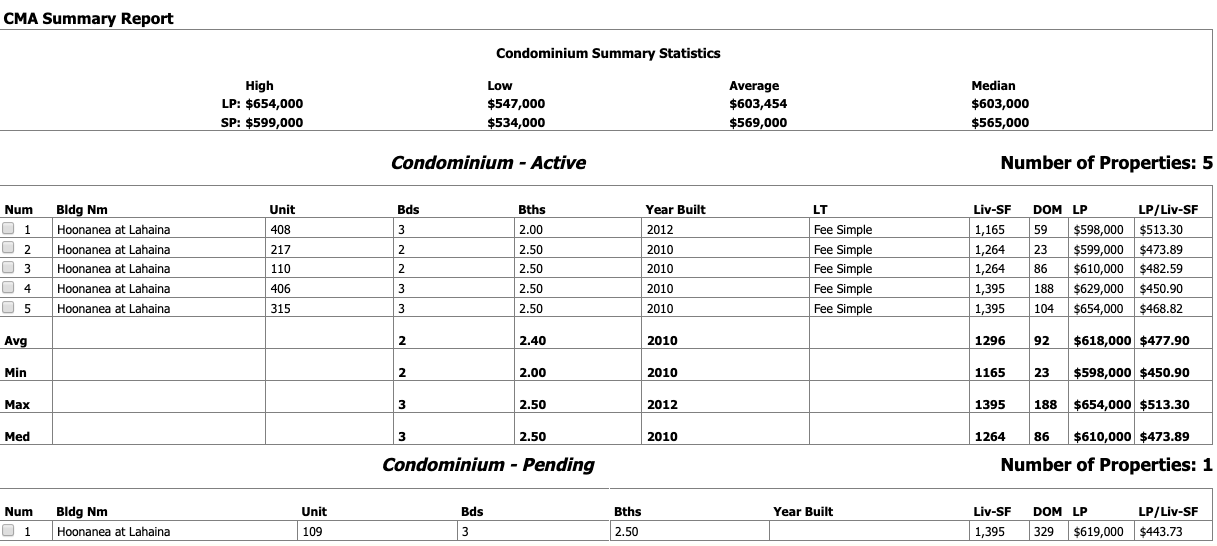
- Currently there are 5 actively listed units for sale
Hoonanea at Lahaina Historical Sales Summary
Hoonanea 2 Bedroom Sales
Hoonanea 3 Bedroom Sales
Hoonanea at Lahaina Active Market


