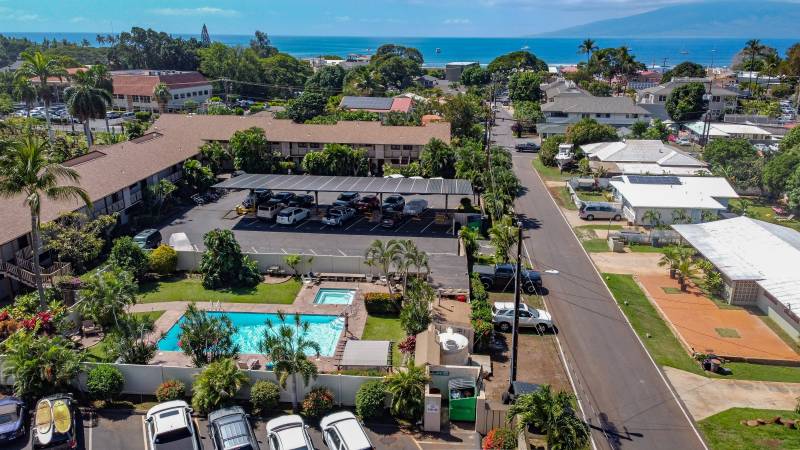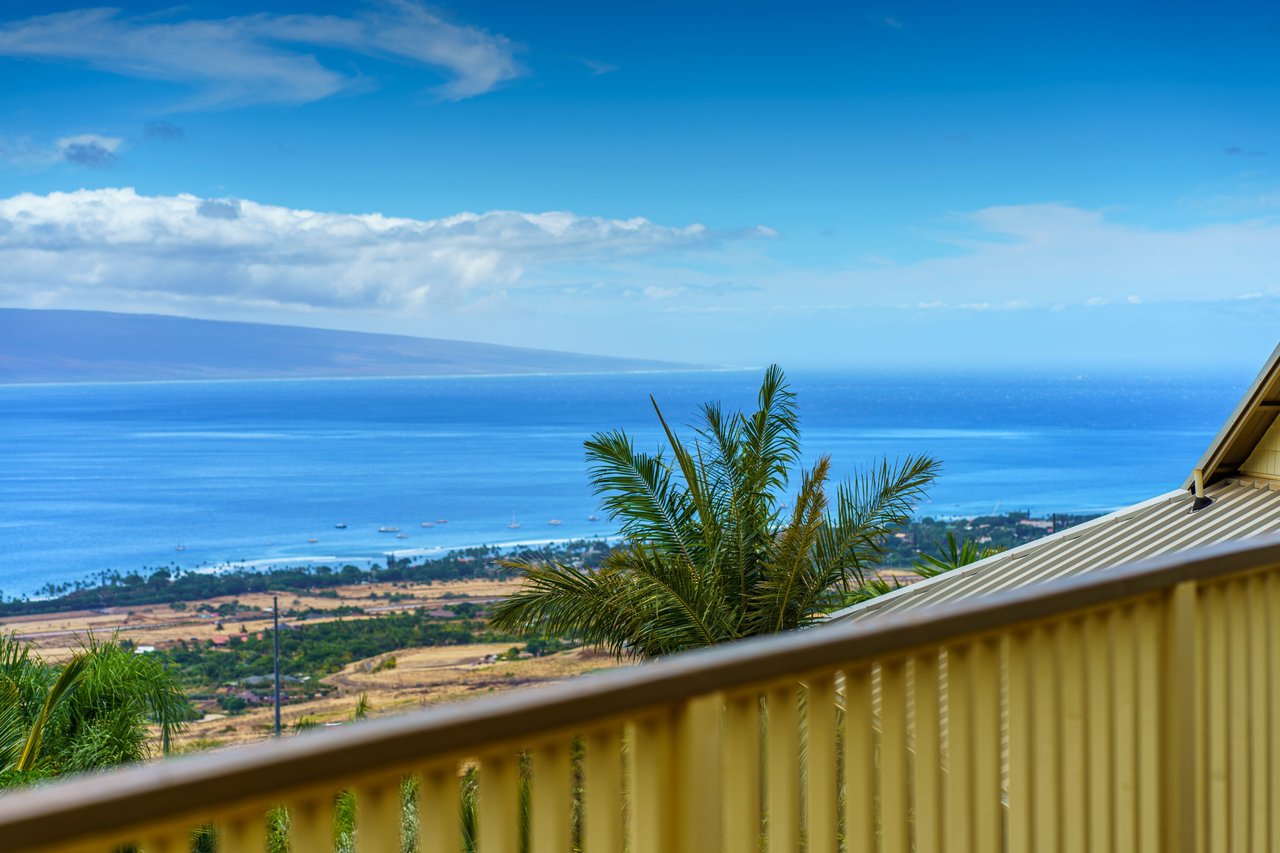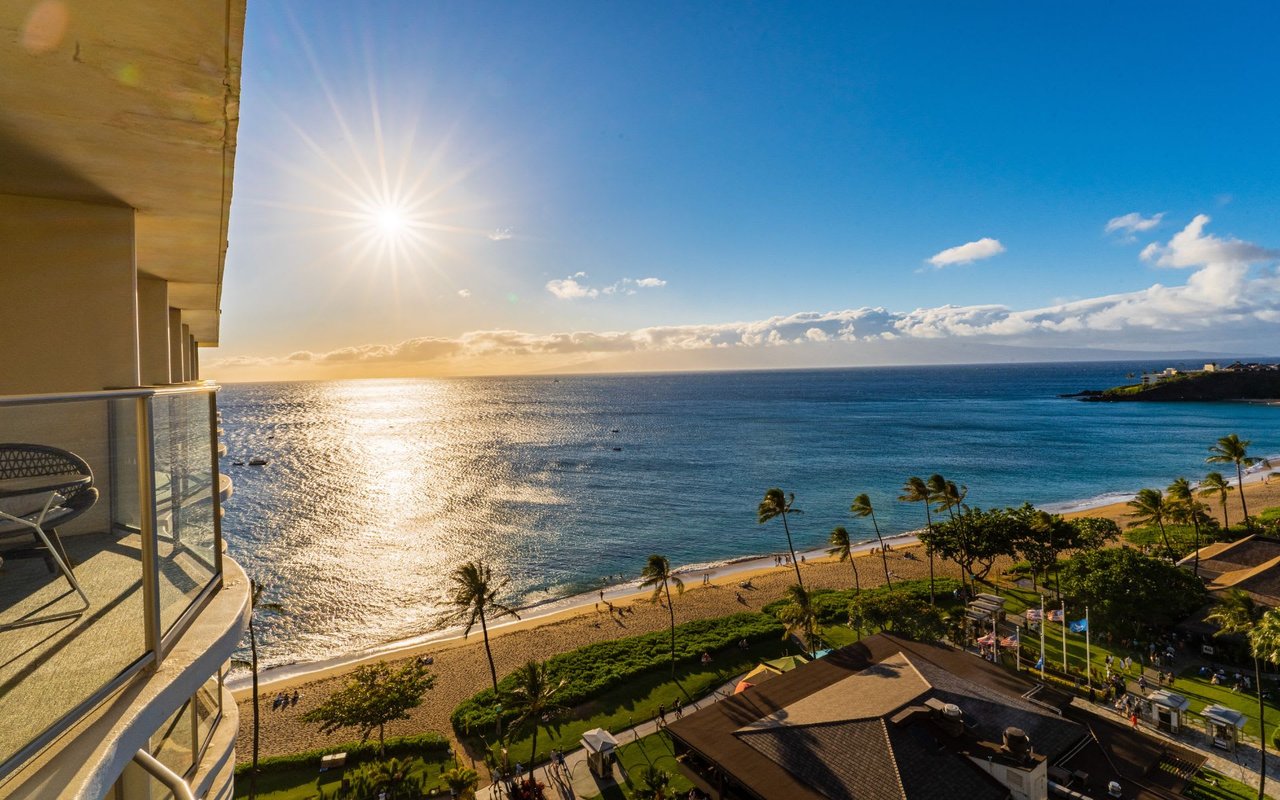
As part of my commitment to keeping the community informed about West Maui’s micro-market real estate environment, I’m bringing you an up-to-date, comprehensive market summary of South Lahaina Town covering the residential areas of Shaw St to Puapihi St, including Front St – West Maui’s Gold Coast residential neighborhood.

What You’ll Find
- Actual Sales Prices: learn exactly how much specific properties sold for
- Sales Volume: see the strength of the market in terms of how many properties sold
- Days on Market: understand how long it takes the average property to sell
- List Price vs. Sold Price: see how the final sales price compares to the listing price
- Price Per Square Foot: which is critical in calculating real estate values
- Asset % Growth: what is the year over year appreciation of my property
- Current Inventory: what is actively for sale and currently under contract
Before we dig into the numbers, make sure you subscribe to my blog if you want to be notified of future market reports as they come available.

South Lahaina 2019 | Market Headlines
- There were 9 total sales – the 2nd highest total since 2004
- The median price rose 8% to $850K
- There was 1 oceanfront sale (399 Front St $3.825M)
- Even though we’ve seen steady price increases over the past few years, the Sharkpit, Kauaula, Aholo, and Puamananui areas still have elevated Buyer demand and on an upward trend. For reference, the 2013 median price was $661K.
- Furthermore, 2019 had an average of 133 days on market (from actively listed to closing date), which was 30 days better (164) than 2018 and nearly 70 days better than 2017 (201).
- Currently there are 2 actively listed properties for sale and none under contract.
South Lahaina Residential Historical Sales Summary