As it is my commitment to keeping the local community informed, I am pleased to share with you the most recent West Maui home, land, and condo sales reports for your review — covering Kaanapali, Kapalua, Lahaina, and Launiupoko. You’ll find real estate sales volume, days on market, list versus sold price, price per square foot, and significantly more.
West Maui August 2020 Headlines
For further details on any of the statements below, please refer to the sales reports.
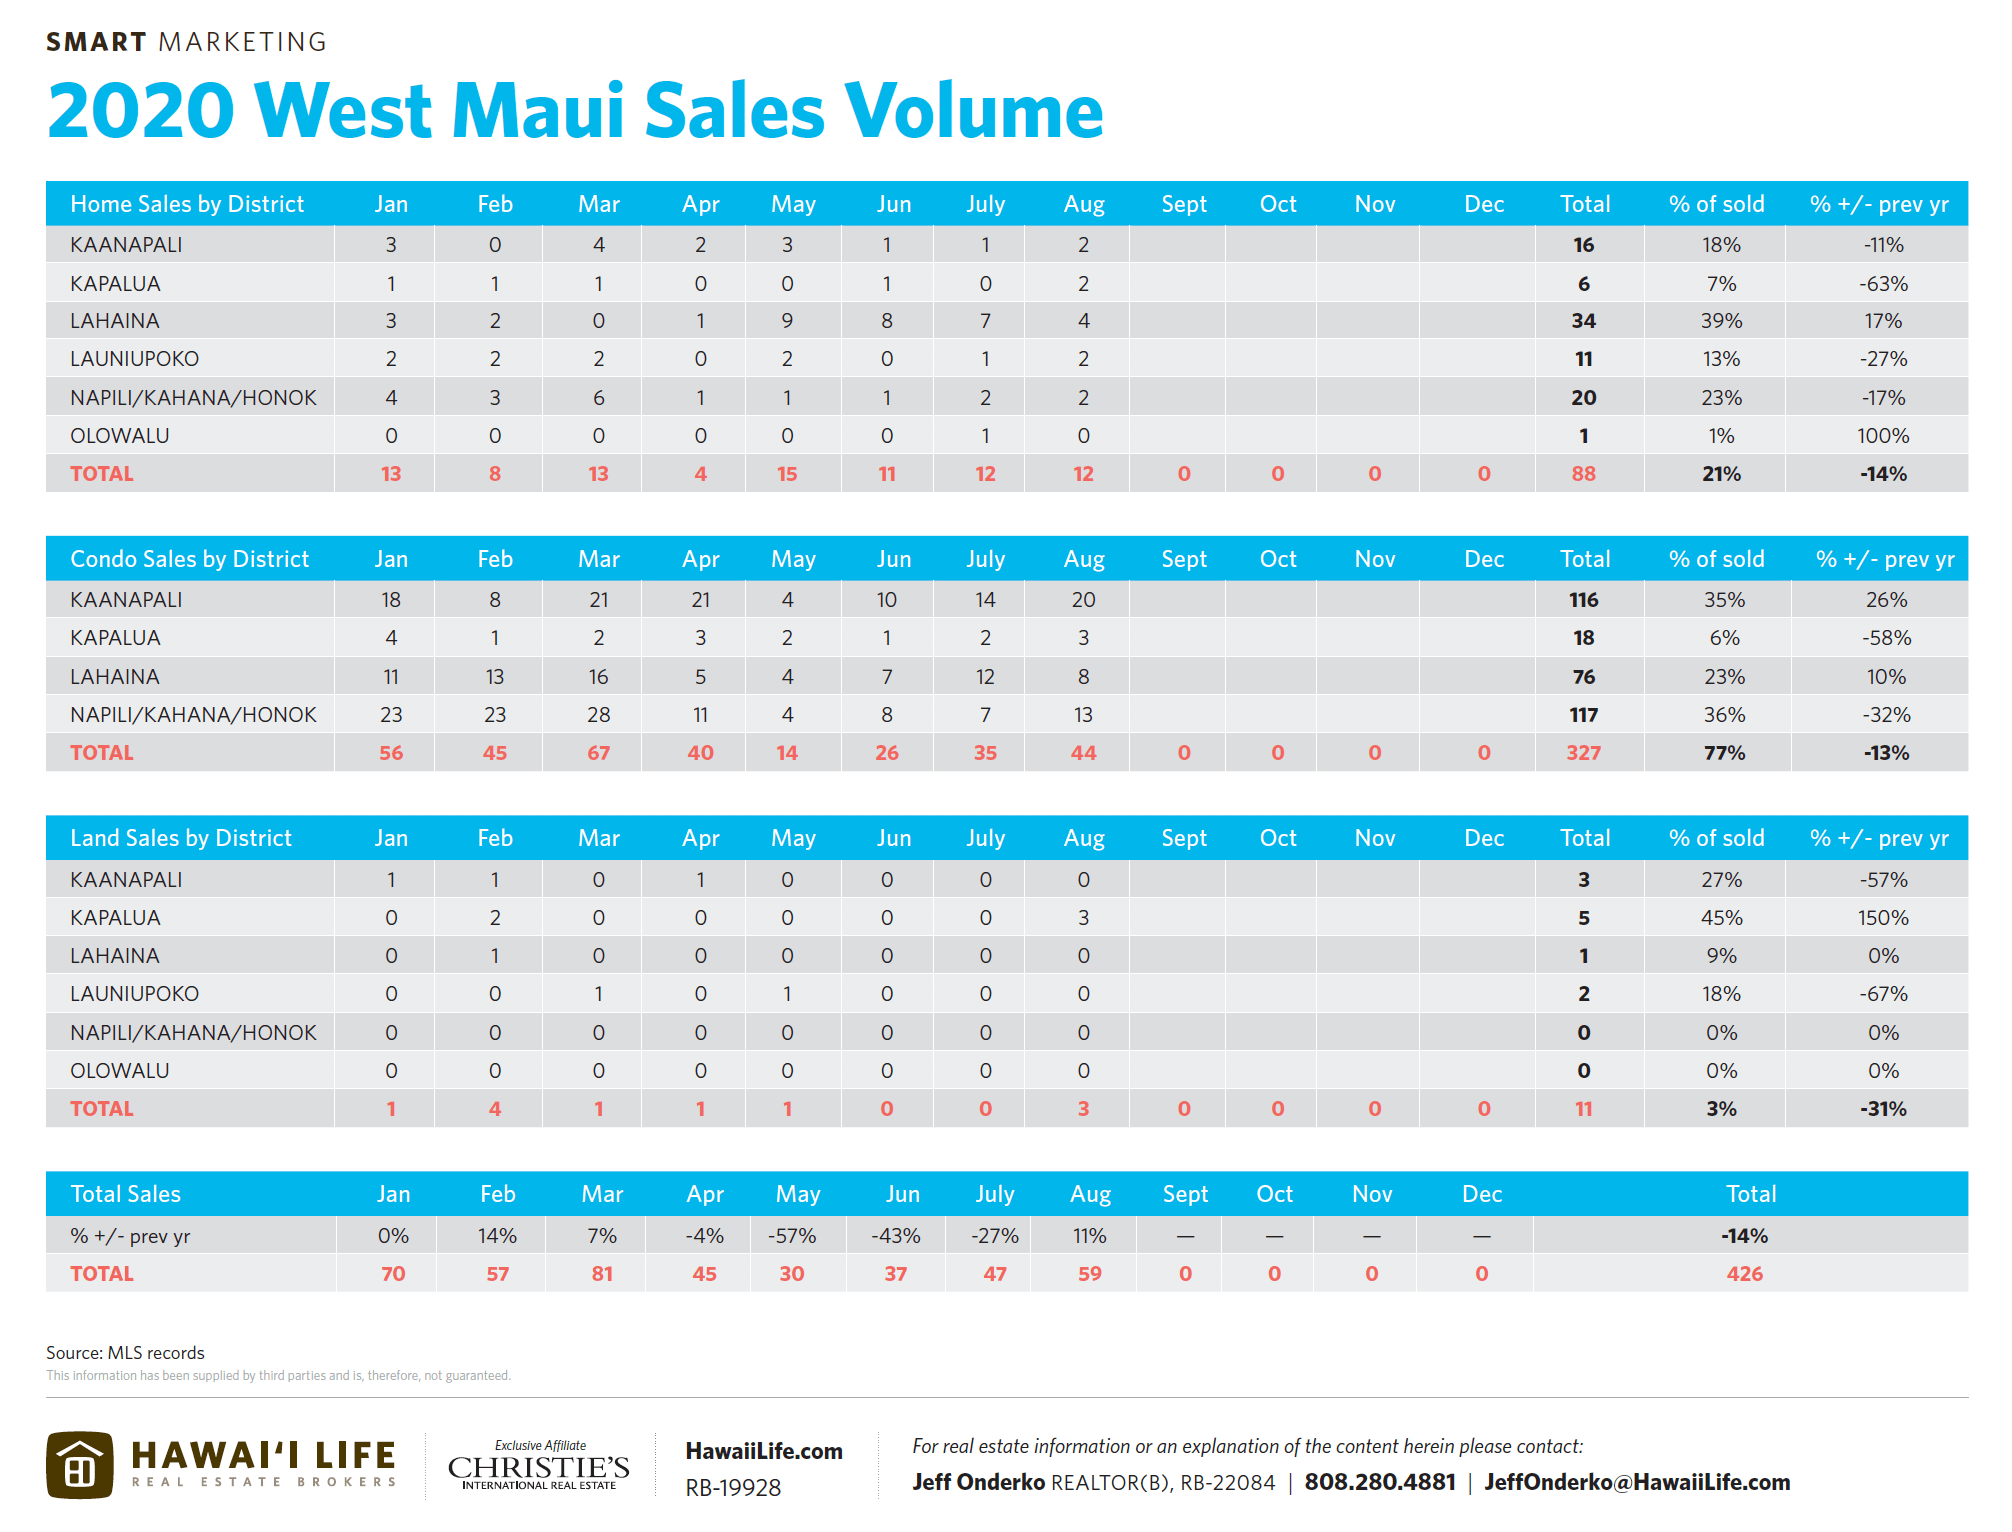
- 59 sales in July | Highest total since March (2019 avg was 65/ month)
- New development in demand as Kaanapali’s Luana Kai and Lahaina’s Kahoma Village are selling strong (30% of all West Maui home & condo sales)
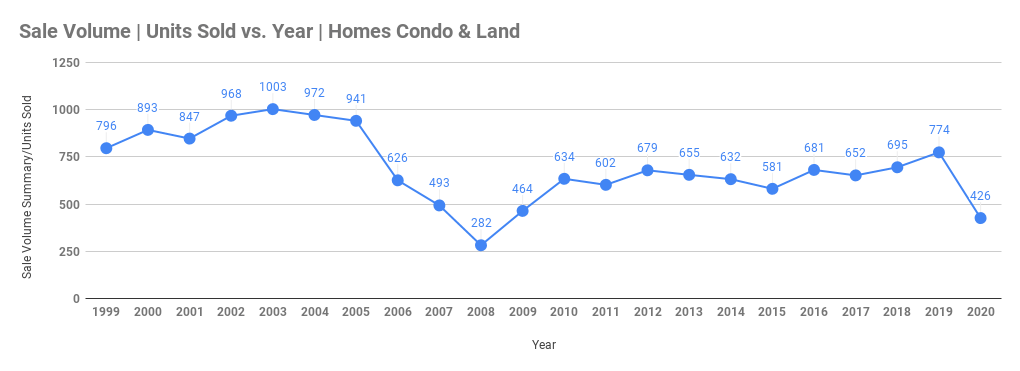
- Overall WM sales volume is down a modest -14% from previous year considering the shit storm our island’s personal & business environment has faced on in 2020 | The $1M+ market is only down 5%.
- Residential Days on Market is down roughly 20 days compared to 2019 while condo DOM is up more than 25 days.
- Land is moving fast, nearly 70 days on market faster than last year.
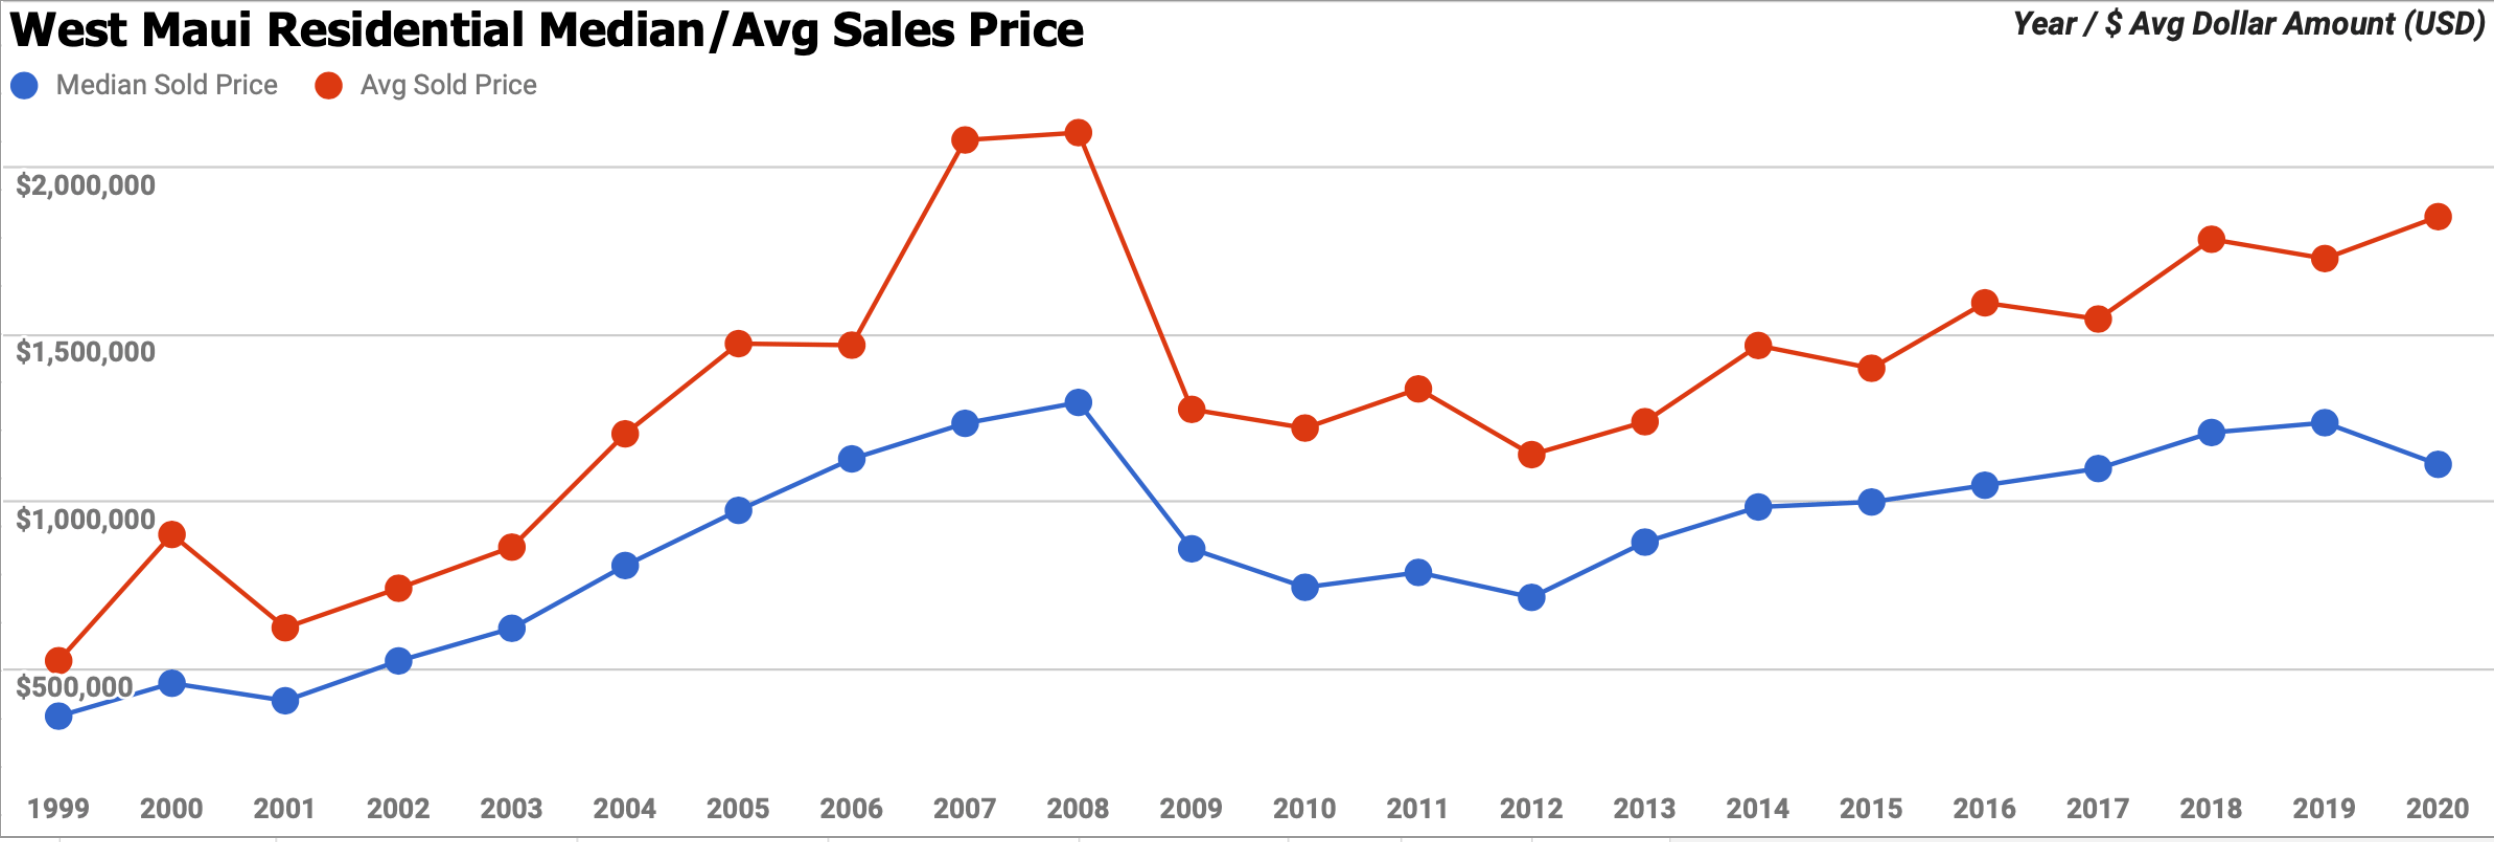
- Median Home Prices are down 10% | Condos prices up 12% | Land +7%
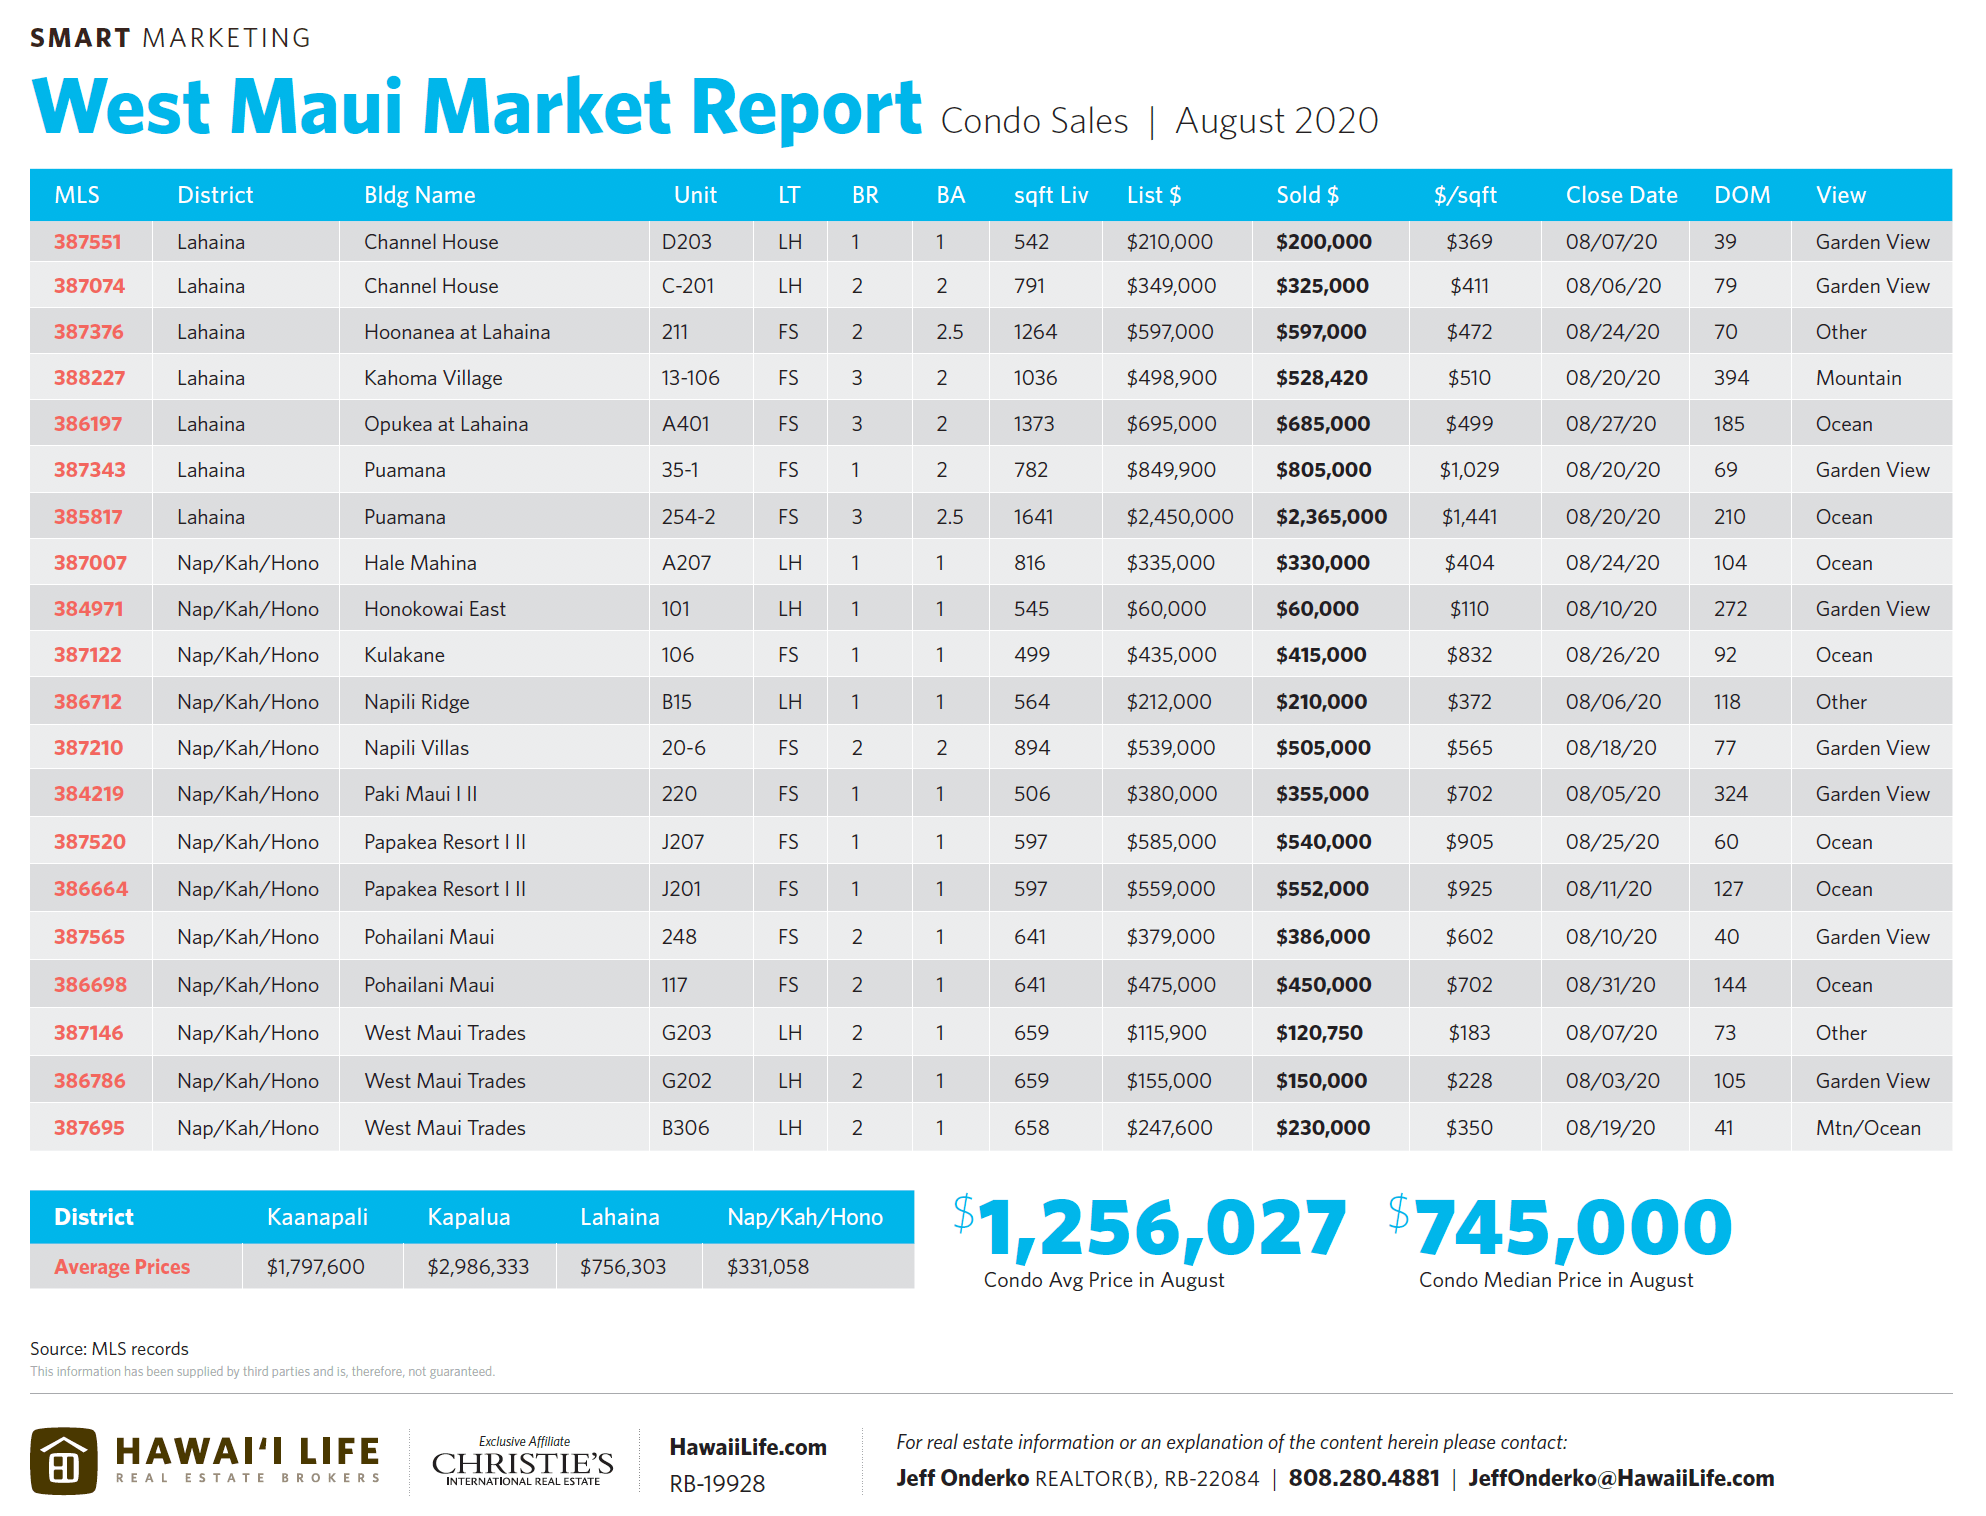
- Median Sales Prices
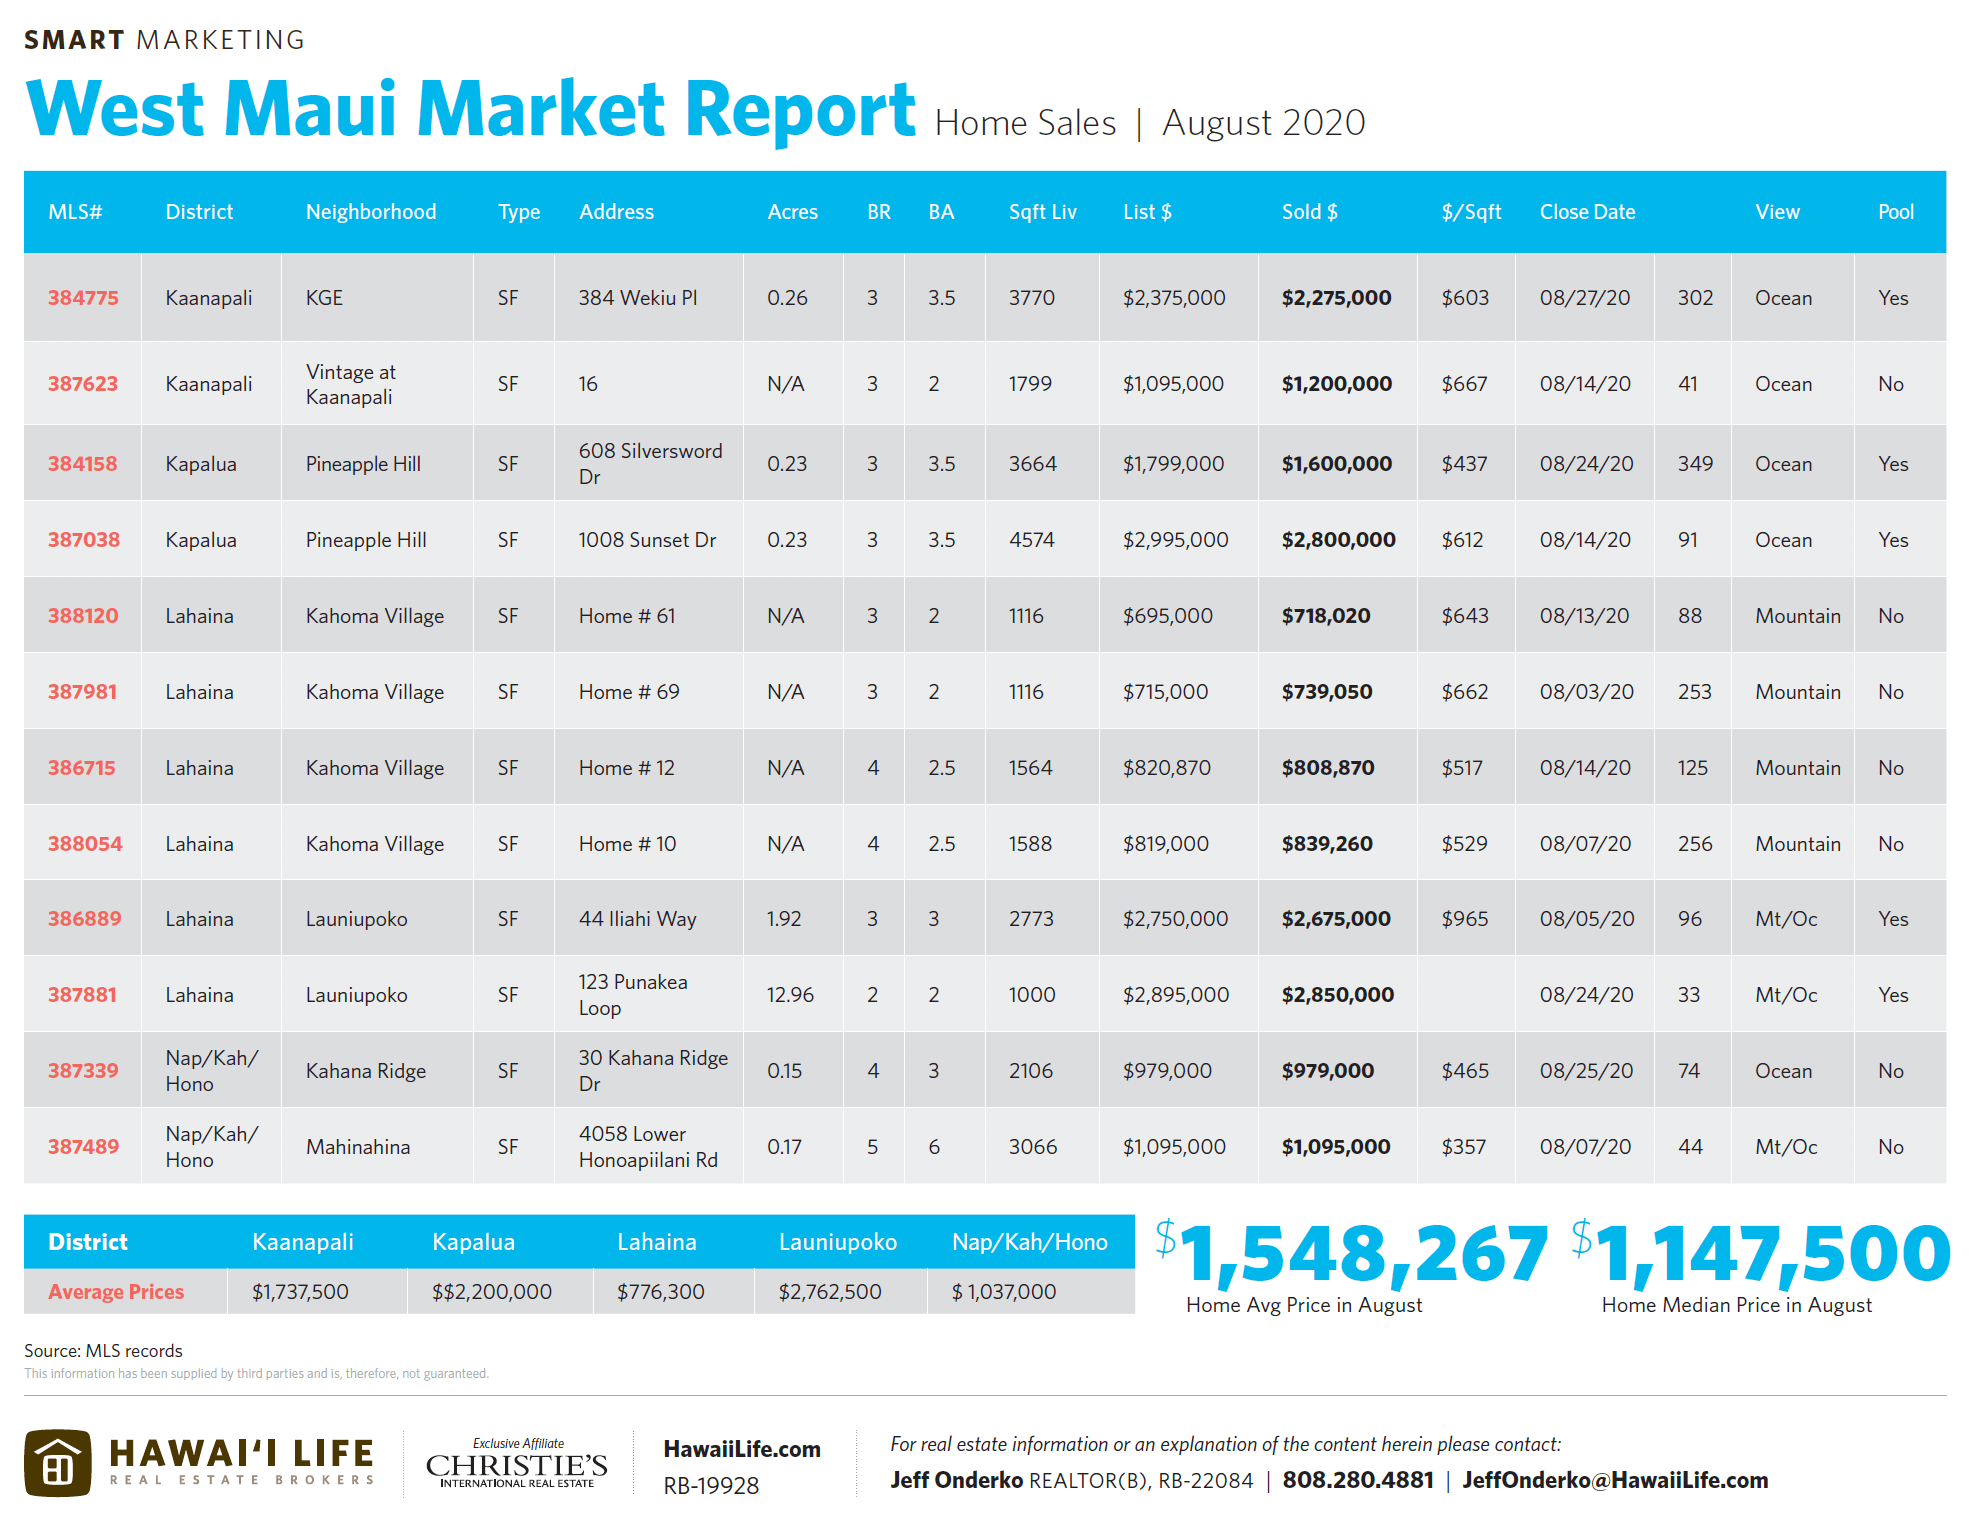
- Homes: August $1,147,500 July $829,635K
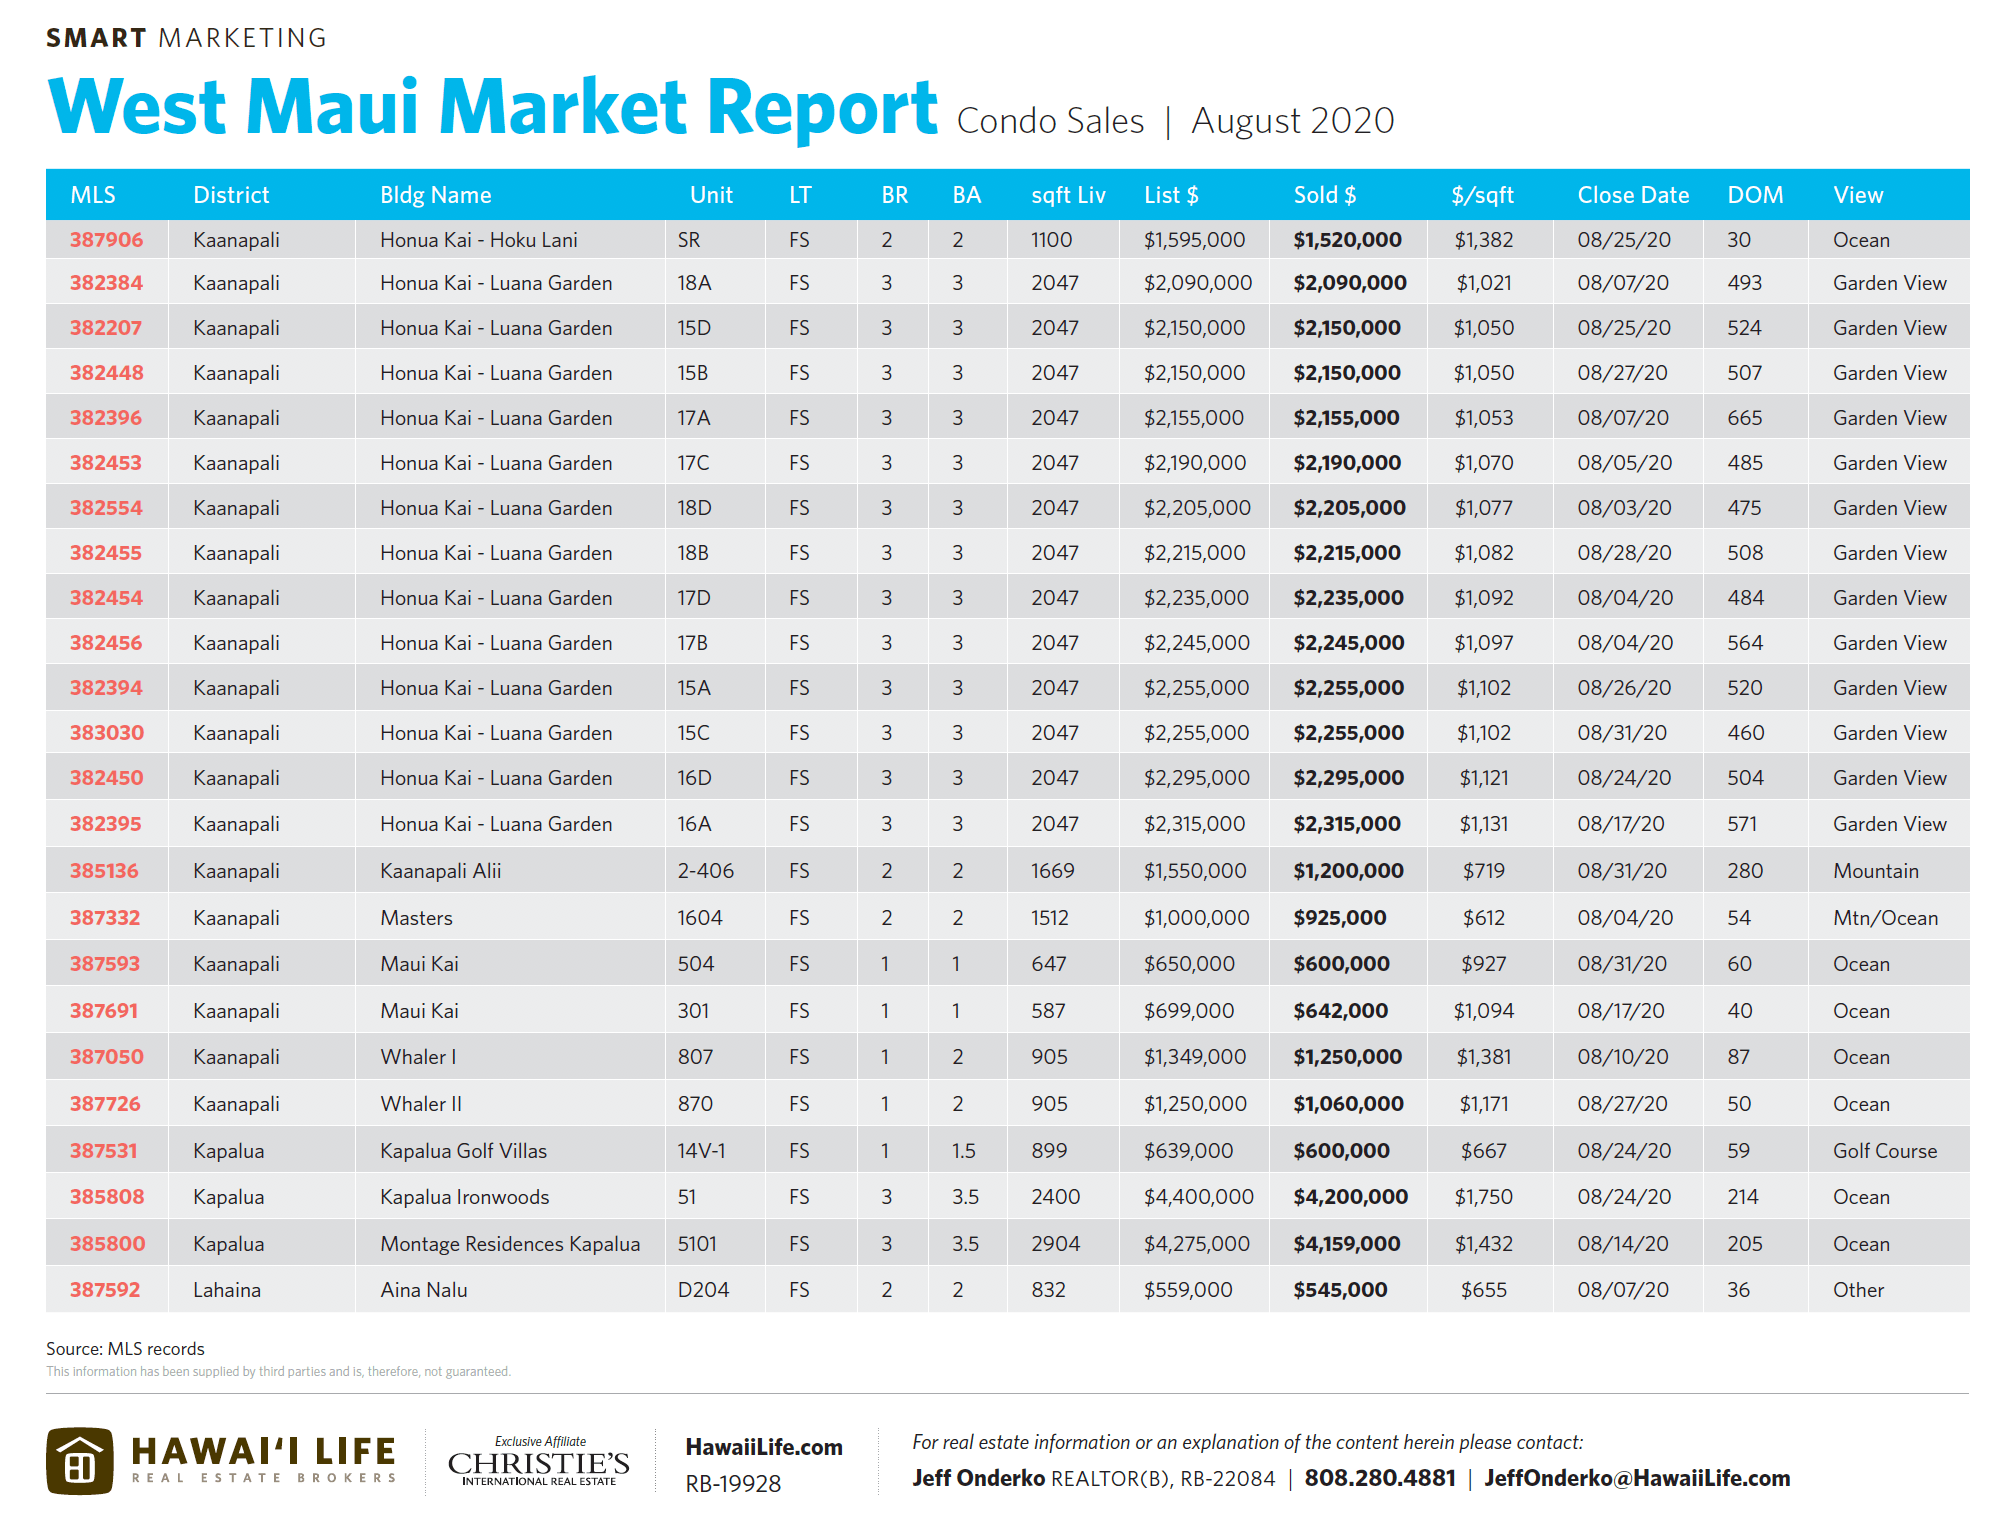
- Condos: August $745,000
- Land: $900,000
- Highest Priced Sales
- Home – $2.85M | Launiupoko
- Condo – $4.2M | Kapalua Ironwoods
- Land – $8M | Kapalua Place
- Lowest Priced Sales
- Home – $718K | Lahaina’s Kahoma Village
- Condo – $60K | Honokowai East in Nap/Kah/Hono neighborhood
- Land – $800K | Plantation Estates, 2.14 acres
Historical Median & Average Price Comparison