Residential Home Sales Dominate West Maui Fall Season

Residential Home Sales Dominate West Maui Fall Season

As we head into month 12 of 2020, West Maui Residential Home sale volume is up 9% over 2019, which could be considered a shockingly fantastical statistic after what the state of Hawaii and our island has experienced this year. A not-so-shockingly fantastical statistic is that West Maui condominium sales are down -21% in 2020.
 
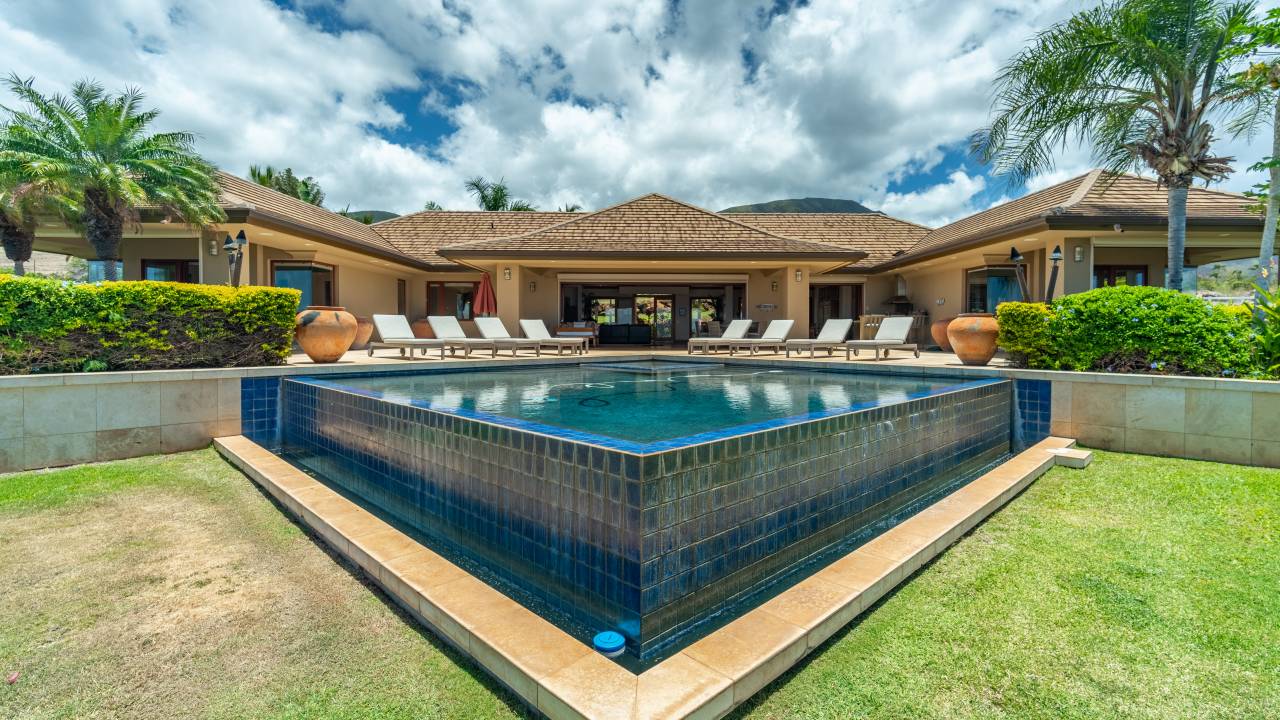
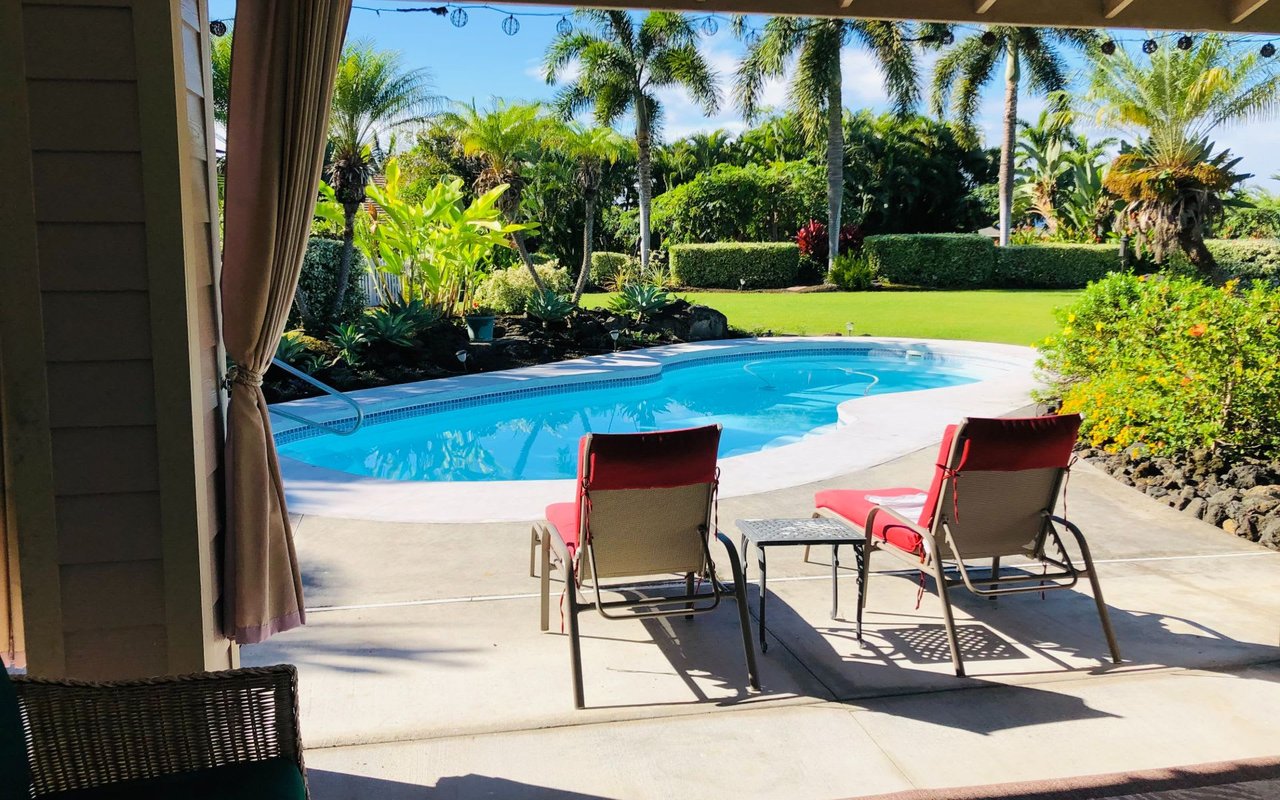
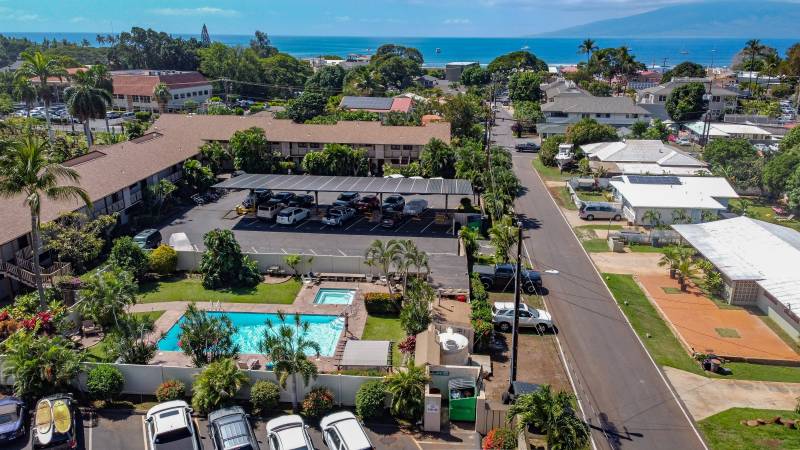
Tropical garden and lawn overlooking the ocean and a distant mountainous island.
 
The latter statistic is brought to attention as it has way more significance on the future market picture. Condos historically have made up 75%-79% of West Maui’s entire annual sales inventory. With condos and little to zero rental income, what in the past has been hard to show and easy to sell has become easy to show and hard to sell.
 
With that being said, I am pleased to share with you the most recent West Maui home, land, and condo sales reports for your review — covering Kaanapali, Kapalua, Lahaina, and Launiupoko. You’ll find real estate sales volume, days on market, list versus sold price, price per square foot, and significantly more.
 

West Maui November 2020 Headlines

For further details on any of the statements below, please refer to the sales reports.
 
  • Another Impressive Sales Month | 75 Homes, Land & Condos Close
  • Highest Sales Volume Total Since March
  • 30 Home Sales | Best in Many Many Years
  • Market Gaining End of Year Momentum | Volume Off By Only 16%
2020 West Maui sales infographic comparing monthly home, condo, and land sales by district.
 
Line chart of annual home, condo, and land sales, 1999–2020, with a low of 282 in 2008 and 598 in 2020.
 

Highest Priced Sales

  • Home – $5.23M | Launiupoko
  • Condo – $3.68M | Lahaina Town
  • Land – $1.7M | Launiupoko

Lowest Priced Sales

  • Home – $580K | Lahainaluna
  • Condo – $150K | West Maui Trades in Nap/Kah/Honokowai areas
  • Land – $475K | Kaanapali & Olowalu
West Maui home sales market report table for November 2020.
 
West Maui November 2020 home sales report with sales tables, district average prices, and October price figures.
 
West Maui condo sales report for November 2020, with MLS sale details organized in a table.
 
West Maui November 2020 condo market report with sales table and average and median price figures.
 
West Maui November 2020 land sales report with six transactions and district price summaries.

Historical Median & Average Price Comparison

Line chart of annual home, condo, and land sales, peaking at 1,003 in 2003 and falling to 282 in 2008.
West Maui home sales table for 2016–2020, including median and average prices, year-over-year changes, days on market, and sales counts.

 
Line chart comparing West Maui condo median and average sold prices from 2001 to 2020.

 
Table comparing residential home sale prices, year-over-year growth, days on market, and sales from 2016 to 2020.

 

Chart comparing West Maui land median and average sold prices from 1999 to 2020.

Table of residential home sales data from 2016 to 2020, including prices, days on market, and sales counts.
 

Work With Jeff

Have questions about the area(s) or the real estate market? From his work and life experience, Jeff has an expertise and love for Resort markets and Resort marketing. Get honest, professional assistance in determining current property value, differentiating available inventory, crafting a competitive offer, writing and negotiating & more. Feel free to contact him today.

Follow Jeff On Instagram