As part of my commitment to keeping the community informed about West Maui’s dynamic, micro market real estate environment, I’m bringing you an up-to-date, comprehensive property market summary of the Whaler at Kaanapali, Kaanapali’s iconic oceanfront resort condo community.

Whaler I & II – Kaanapali Beach’s iconic Twin Towers
What You’ll Find
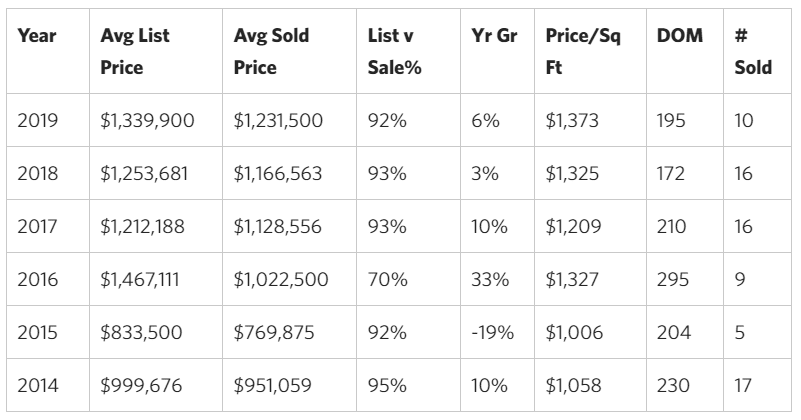
- Actual Sales Prices: learn exactly how much specific properties sold for
- Sales Volume: see the strength of the market in terms of how many properties sold
- Days on Market: understand how long it takes the average property to sell
- List Price vs. Sold Price: see how the final sales price compares to the listing price
- Price Per Square Foot: which is critical in calculating real estate values
- Asset % Growth: what is the year over year appreciation of my property
- Current Inventory: what is actively for sale and currently under contract
Neighborhood Snapshot
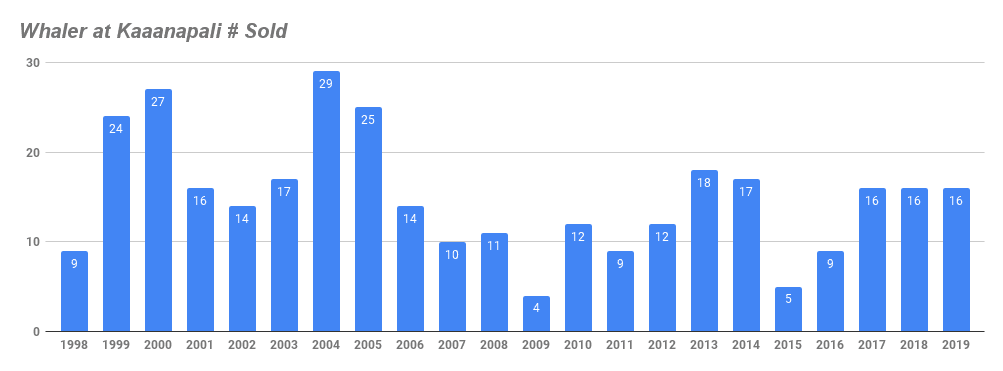
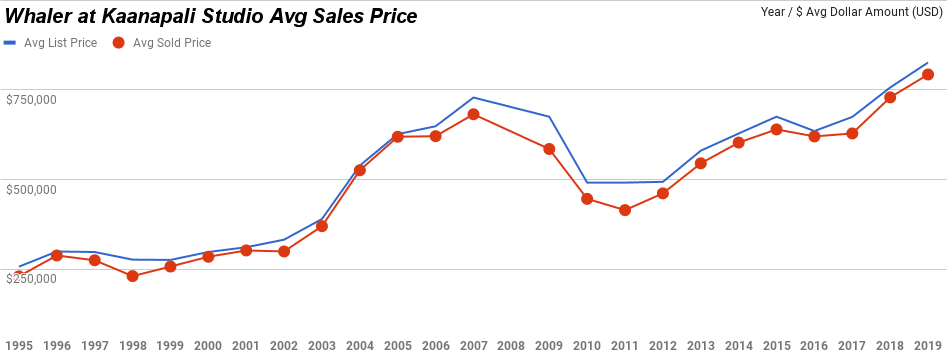
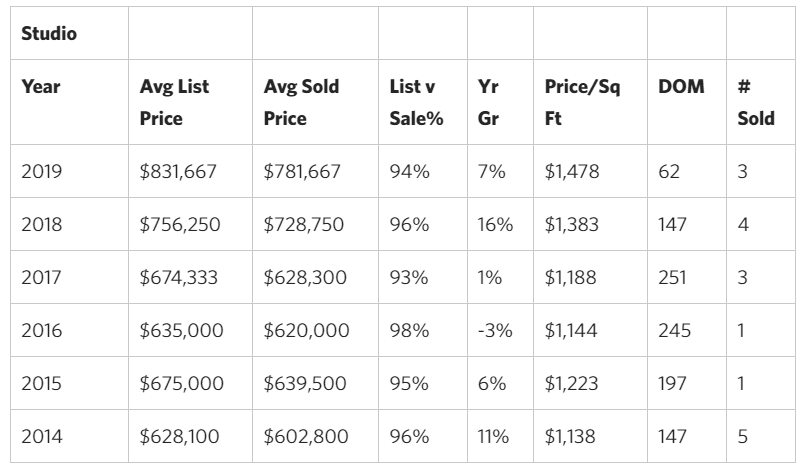
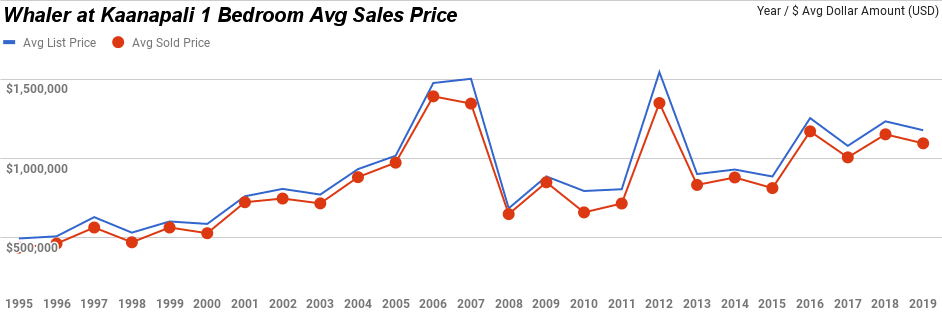
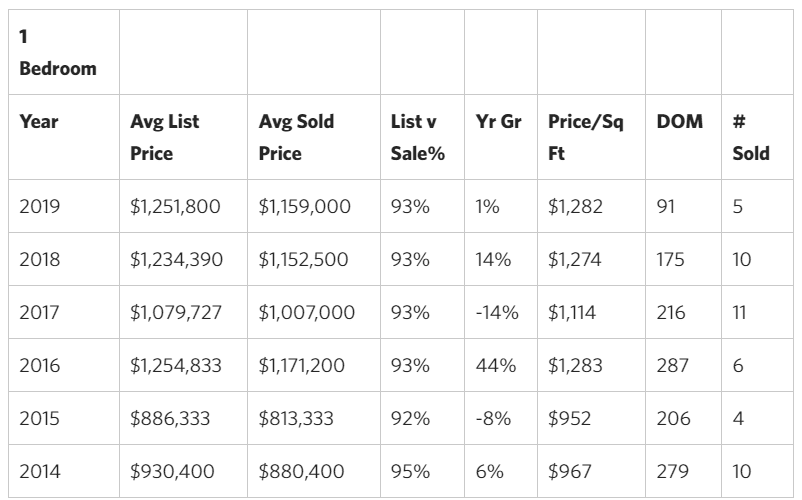
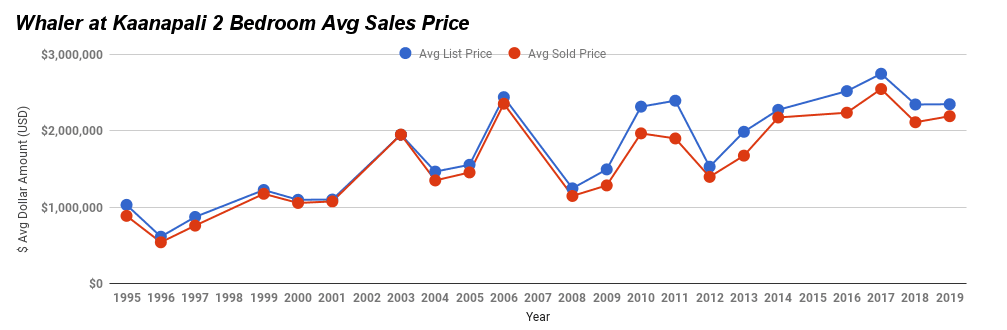
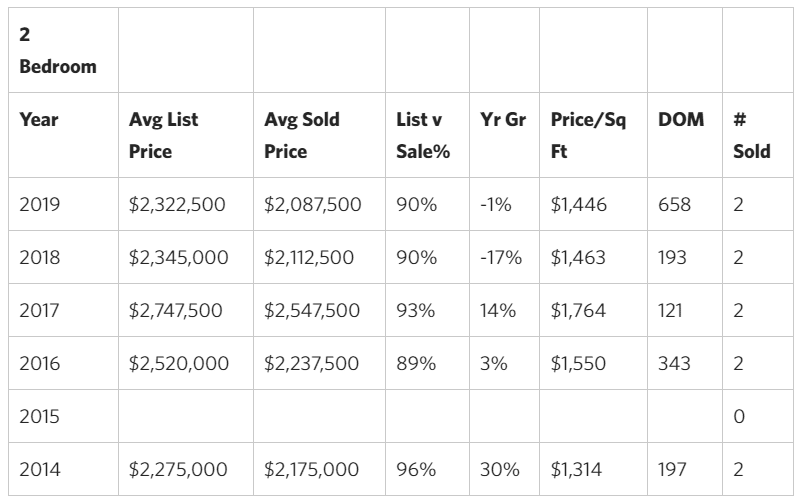
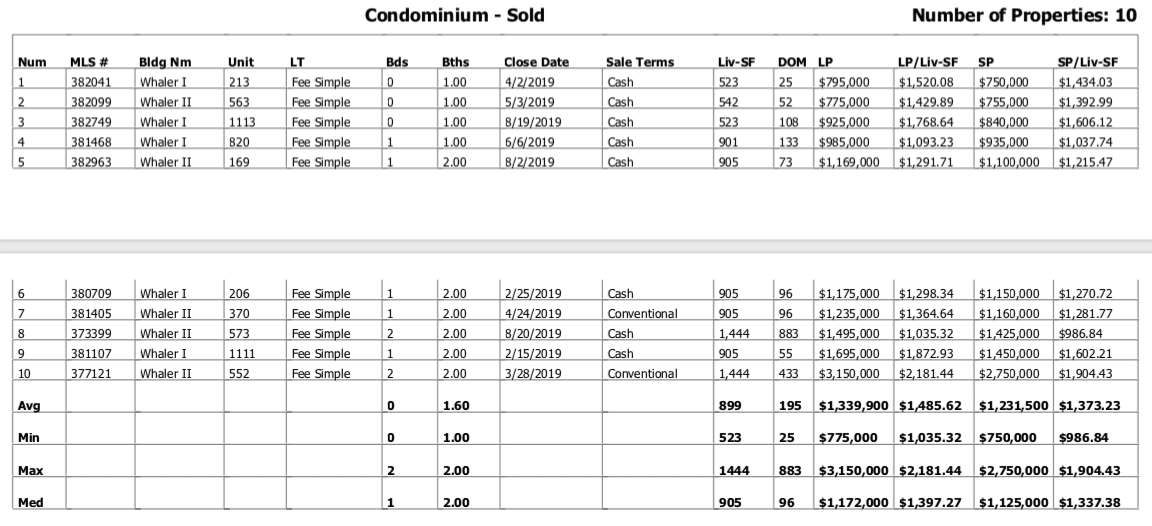
- There have been 10 Whaler sales through 8 months of 2019, and on pace with the last year’s total of 16 (16 for 2017 as well). Studio & 1-bedroom units particularly have been in high demand producing just 61 & 91 days average time on market from day listed to closing. Note: The average 2019 DOM for West Maui short term vacation rental properties is 154 days. While the 2-bedroom sector has been pretty sluggish with the 2 units that sold this year spent 658 days on market.
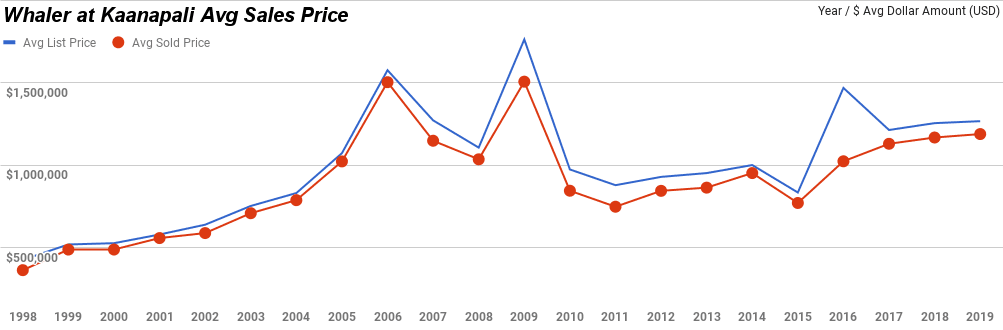
- Prices are once again up with the Whaler Avg sale price seeing positive growth for 4 consecutive years now, 2019 +6%
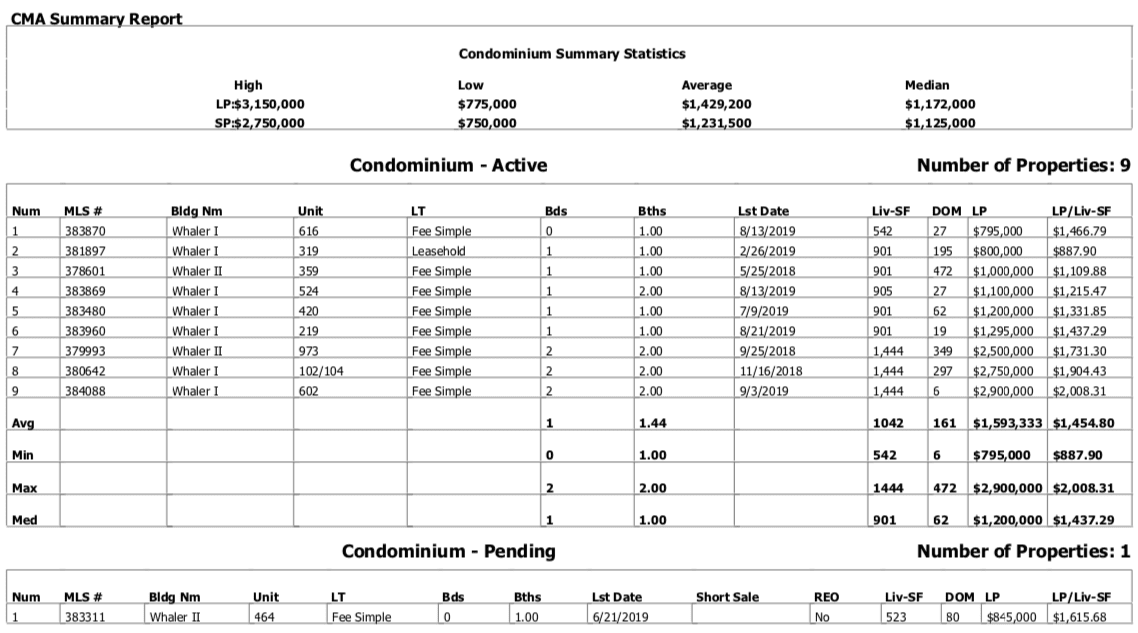
- There are 9 actively listed units available for sale.