Launiupoko | Cottage Sales Strong, Main Homes on Pace

Launiupoko | Cottage Sales Strong, Main Homes on Pace

As part of my commitment to keeping the community informed about West Maui’s micro-market real estate environment, I’m bringing you an up-to-date, comprehensive market summary of the neighborhoods Launiupoko and Puunoa Estates — West Maui’s premier agricultural estate neighborhoods.

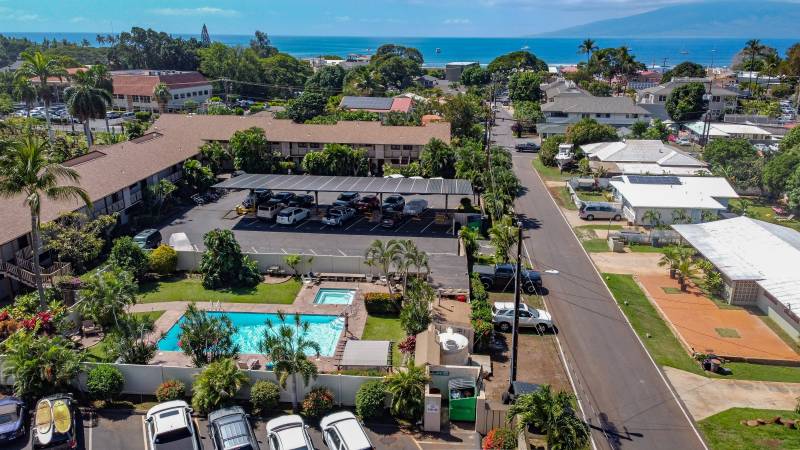
Aerial view of a leafy residential neighborhood with pools beneath rugged mountains.

What You’ll Find  

  • Actual Sales Prices: learn exactly how much specific properties sold for
  • Sales Volume: see the strength of the market in terms of how many properties sold
  • Days on Market: understand how long it takes the average property to sell
  • List Price vs. Sold Price: see how the final sales price compares to the listing price
  • Price Per Square Foot: which is critical in calculating real estate values
  • Asset % Growth: what is the year over year appreciation of my property
  • Current Inventory: what is actively for sale and currently under contract

Before we dig into the numbers, make sure you subscribe to my blog if you want to be notified of future market reports as they come available.

Subdivision map with a red-highlighted area and the New Bypass Road marked in red.

Current Market Snapshot

It’s easy to say it’s still the #1 choice for luxury Buyers wanting the benefits of agricultural space/acreage mixed into a residential neighborhood. Cottage sales remain strong while main home sales are on pace to match 2019 volume.

There are currently 13 homes actively listed for sale ($1.25M – $8.75M) and 6 land parcels for sale listed ($675K – $2.7M).

Launiupoko Main House Sales Summary

Line chart compares average list and sold prices for Launiupoko, Makila, and Puunoa main houses, 2001–2020.

Bar chart of Launiupoko/Makila/Puunoa main-house sales, peaking at 20 in 2017.

Launiupoko/Makila/Puunoa main-house sales table for 2015–2020, including average prices and days on market.

Launiupoko Cottage Sales Summary

Cottage price chart comparing average list and sale prices in Launiupoko, Makila, and Puunoa, 2003–2020.

Bar chart of Launiupoko, Makila, and Puunoa cottage sales by year, peaking at 12 in 2006.

Table of Launiupoko cottage average sold prices and sales statistics from 2015 to 2020.

Launiupoko Main House Sales Summary – By Acre

Launiupoko & Puunoa neighborhoods range from .5 acres to 15+ acre estate lots. The reason why I breakdown sale per acre is to get a more precise apples to apples approach when comparing property sales and value.

Line chart comparing average sale price per acre by year and acreage category in Launiupoko, Makila, and Puunoa.

Table of Launiupoko-area main-house average sale prices per acre by year and acreage range, with sales counts.

Launiupoko Cottage Sales Summary –  By Acre

Line chart of Launiupoko, Makila, and Puunoa cottage sales prices by lot size from 2003 to 2020.

Launiupoko/Makila/Puunoa cottage average sold prices by acreage and year, 2015–2020.

Launiupoko Land Sales Summary – By Acre

Line chart compares average land sale prices by acreage in Launiupoko, Makila, and Puunoa from 2000 to 2020.

Bar chart of Launiupoko, Makila, and Puunoa land sales, 2000–2020; sales peaked at 20 in 2007 and 2010.

Launiupoko/Makila land sale statistics table for 2015–2020, including prices, year-over-year change, and sales counts.

Work With Jeff

Have questions about the area(s) or the real estate market? From his work and life experience, Jeff has an expertise and love for Resort markets and Resort marketing. Get honest, professional assistance in determining current property value, differentiating available inventory, crafting a competitive offer, writing and negotiating & more. Feel free to contact him today.


Follow Jeff On Instagram