West Maui Lux Sector Reaps Historic Highs | Residential Market Cranks Amid Covid

West Maui Lux Sector Reaps Historic Highs | Residential Market Cranks Amid Covid

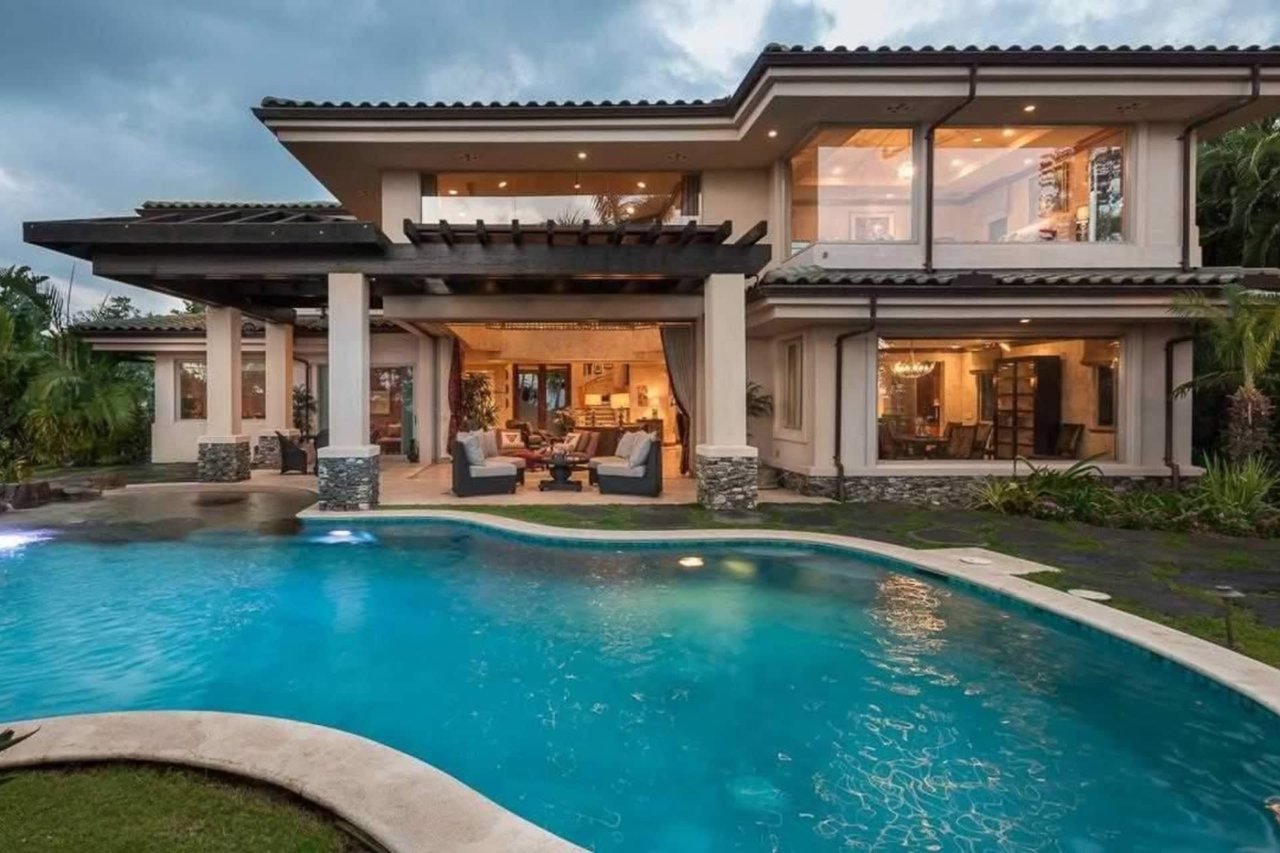
West Maui finished the year insanely strong with 91 sales in December — the highest monthly total in the past 15 years. In addition to volume, prices remain very healthy and trending upward, especially in the residential/single-family sector. For example, in December alone eight homes sold for more than $3M with one of those closing for $24M – it’s easy to see how the 26 transactions could end up averaging $2.7M/sale.
 
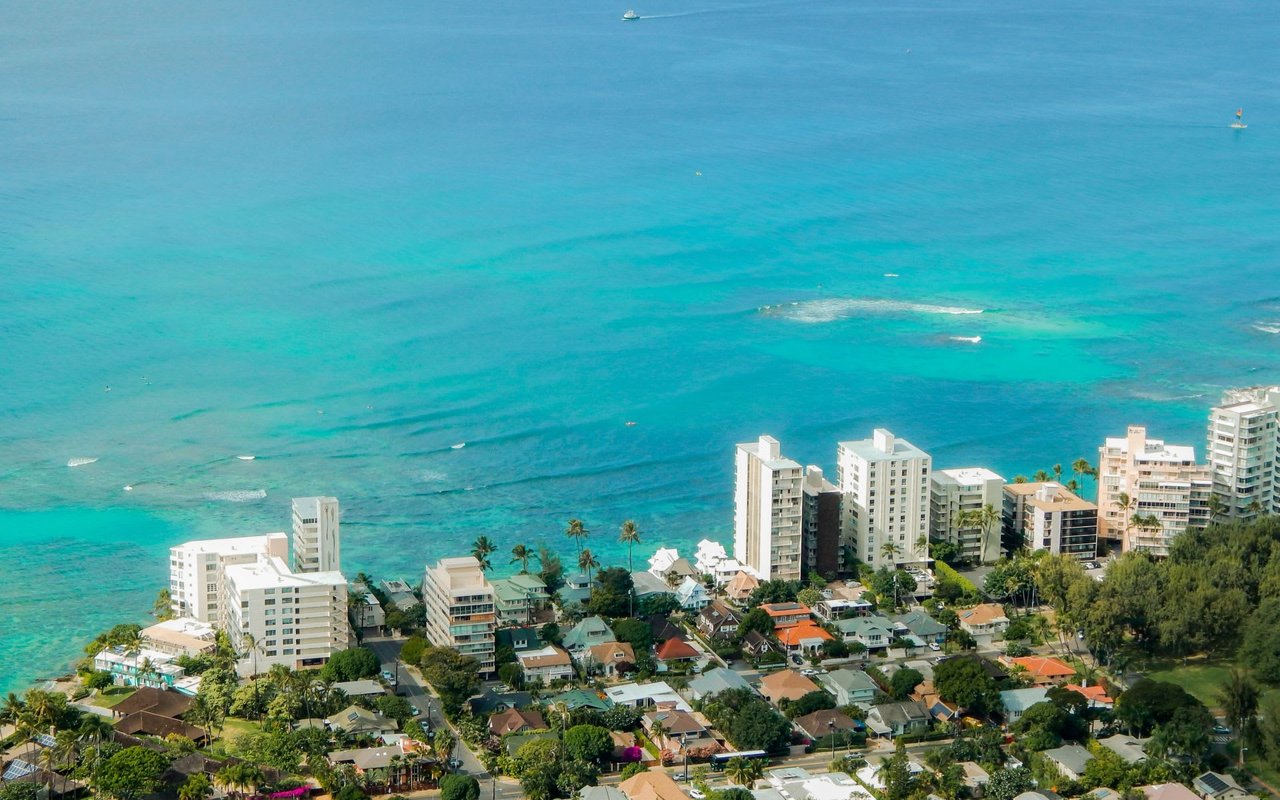
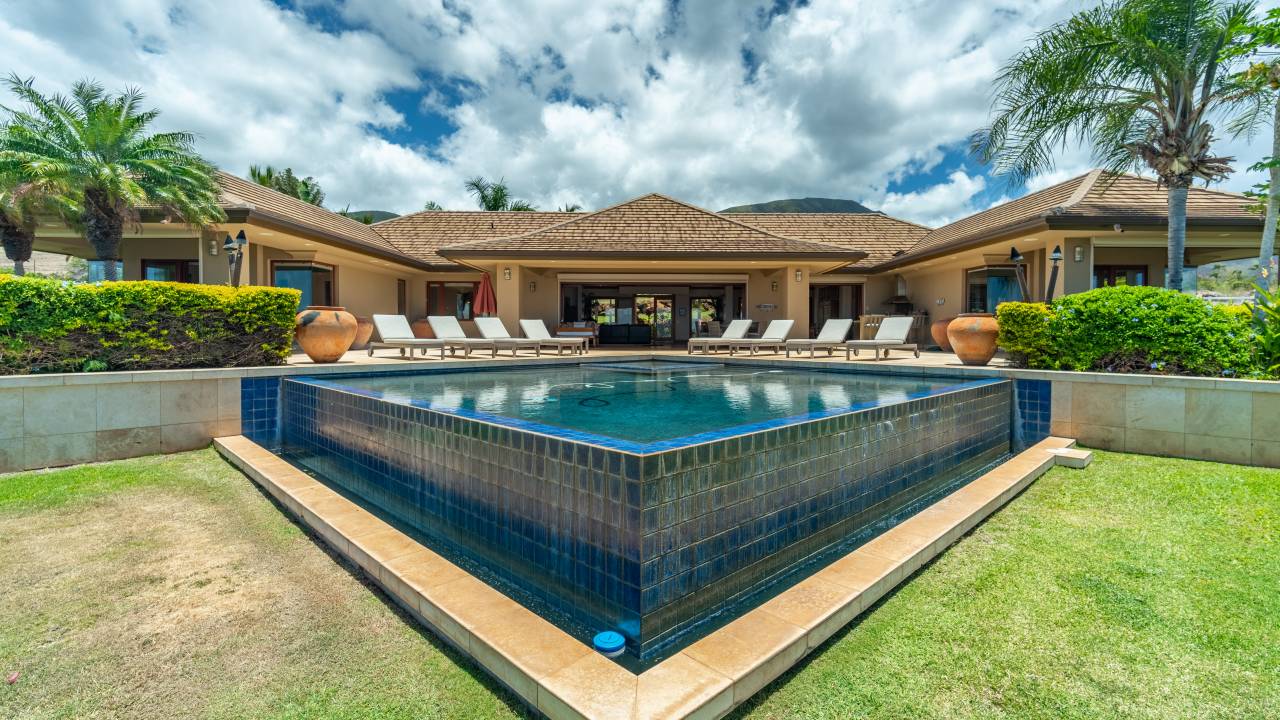
Oceanfront lawn with palm trees and sunlight breaking through clouds.
 
With that being said, I am pleased to share with you the most recent West Maui home, land, and condo sales reports for your review covering Kaanapali, Kapalua, Lahaina, and Launiupoko. You’ll find real estate sales volume, days on market, list versus sold price, price per square foot, and significantly more.
 

West Maui December 2020 Headlines

For further details on any of the statements below, please refer to the sales reports.

  • For the year, West Maui alone had (10) trades $5M+ (5) trades at $8M+ and (3) north of $14M. By far the strongest of any single period in West Maui history. Prior to 2020, only 2 properties had ever sold for more than $14M.
  • Demand is High as Days on Market Low – Comparatively & historically speaking, homes and land lots are moving quicker than usual, condos are around the norm.

2020 Notable Numbers

  • Condos: Sales Volume – 8% | Total Sales Revenue – 8.5% ($473M)
  • Homes: Sales Volume +20% | Total Sales Revenue +40%% ($330M)
  • Land: Sales Volume -4% | Total Sales Revenue +10%% ($25M
 
2020 West Maui sales volume infographic with monthly home, condo, and land sales by district.

Line chart of annual home, condo, and land sales, peaking at 1,003 in 2003 and bottoming at 282 in 2008.

Highest Priced Sales

  • Home – $24M | Kapalua
  • Condo – $3.55M | Kapalua
  • Land – $950K | Kapalua

Lowest Priced Sales

  • Home – $379K | Napilihau in Nap/Kah/Honokowai areas
  • Condo – $111K | Maui Sands 1 in Nap/Kah/Honokowai areas
  • Land – $375K | Kaanapali
West Maui December 2020 condo sales report with MLS transaction data and Jeff Onderko contact information.

West Maui December 2020 home sales report table listing sold properties, prices, districts, and sale details.

West Maui December 2020 home sales report with sales tables and October average and median prices.

West Maui condo sales report for December 2020, listing prices, sales, views, and brokerage details.

West Maui December 2020 condo sales report table with listing details and prices.

West Maui December 2020 condo sales report with listing data and average and median prices.

West Maui Market Report for December 2020, with land-sale data and October condo price statistics.

Historical Median & Average Prices

West Maui residential sale price chart, with median and average prices compared from 1999 to 2020.

West Maui land median and average sales prices, charted yearly from 1999 to 2020.

Line chart of annual home, condo, and land sales, peaking at 1,003 in 2003 and falling to 282 in 2008.

Line chart compares West Maui condo median and average sale prices from 2001 through 2020.


Work With Jeff

Have questions about the area(s) or the real estate market? From his work and life experience, Jeff has an expertise and love for Resort markets and Resort marketing. Get honest, professional assistance in determining current property value, differentiating available inventory, crafting a competitive offer, writing and negotiating & more. Feel free to contact him today.

Follow Jeff On Instagram