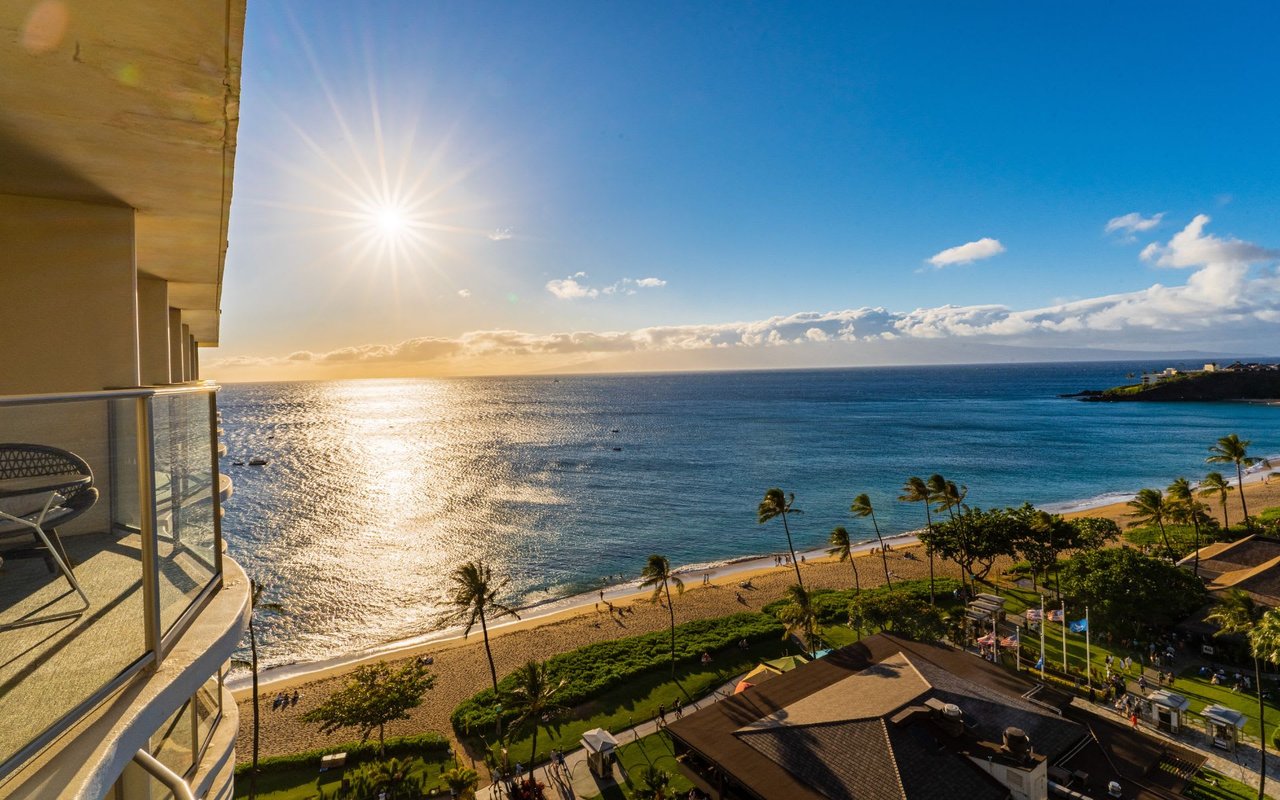
As it is my commitment to keeping the local community informed, I am pleased to share with you the most recent West Maui home, land, and condo sales reports for your review — covering Kaanapali, Kapalua, Lahaina, and Launiupoko. You’ll find real estate sales volume, days on market, list versus sold price, price per square foot, and more.


March 2019 Headlines
- 76 sales in March – 2nd highest since May 2014
- 54 properties went active on the market
- Kapalua Pineapple Hill sells 2 more, 3 more under contract
- Mahana Ridge in Kapalua breaks the ice with 2 land sales
- Napili Villas leads condo market with 6 sales, 5 of them 3-bedrooms
- Highest priced sales: Home – $2.7M Condo – $2.8M Land – $1.9M
- Lowest priced sales: Home – $354K Condo – $249K Land – $700K

March Average Home Sale Prices
- Kaanapali – $1.15M (1)
- Kapalua – 2.2M (2)
- Lahaina – $672K (4)
- Launiupoko – $2.51M (3)
- Honoko/Kahana/Napili– $815K (5)
March Average Land Sale Prices
- Kaanapali – $938K (1)
- Kapalua – $1.58M (2)
- Lahaina – No Sales (0)
- Launiupoko – $1.12M (3)
- Honoko/Kahana/Napili – No Sales (0)

March Average Condo Sale Prices
- Kaanapali – $1.3M (9)
- Kapalua – $1.5M (7)
- Lahaina – $665K (6)
- Honoko/Kahana/Napili – $523K (33)

2019 – Q1 Things to Know
West Maui total sales volume is up 26% from 2018 and take into consideration 2018 was 7% over 2017. Condos and land sales are especially strong at +27% & 43% respectively. The Kapalua residential market has something to talk about as Pineapple Hill has been heating up over the last few months. In a neighborhood that averages just over 5 sales/year, PH has seen 4 sales this year, with 3 currently under contract. While prices are still up in Launiupoko, sales have been on the decline and are currently down -29% from the same point last year. I would normally say this is a blip but 2018 was also down -44% from 2017. Lahaina homes always seem to be in demand, and the numbers confirm it — sales are up 50%.
Absorption Rate = The rate at which available homes are sold in a specific market over a specific time. This figure shows how long it will take to exhaust the current inventory supply. In this month’s update, there are 491 active properties and 799 sold in the past 12 months.
- West Maui home, land, and condo inventory combined AR – 7.4 months
- Home AR – 10.4 months
- Condo AR – 6.1 months
- Land AR – 41.4months