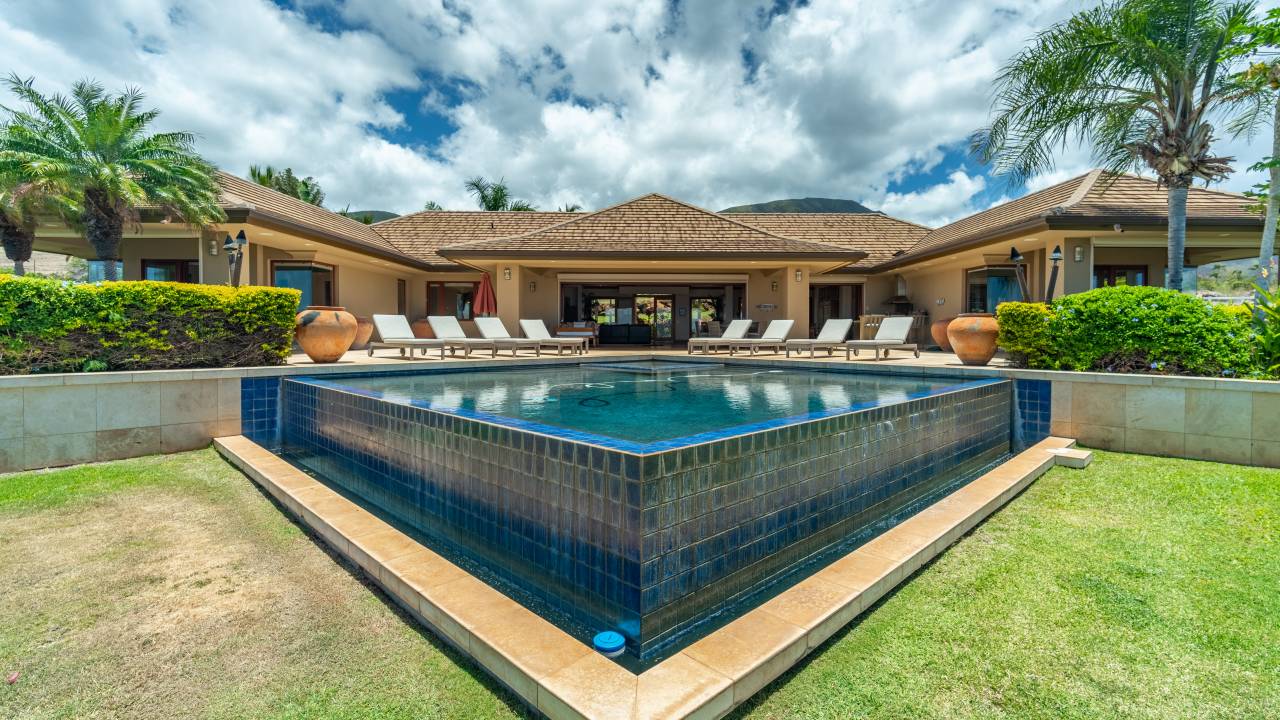
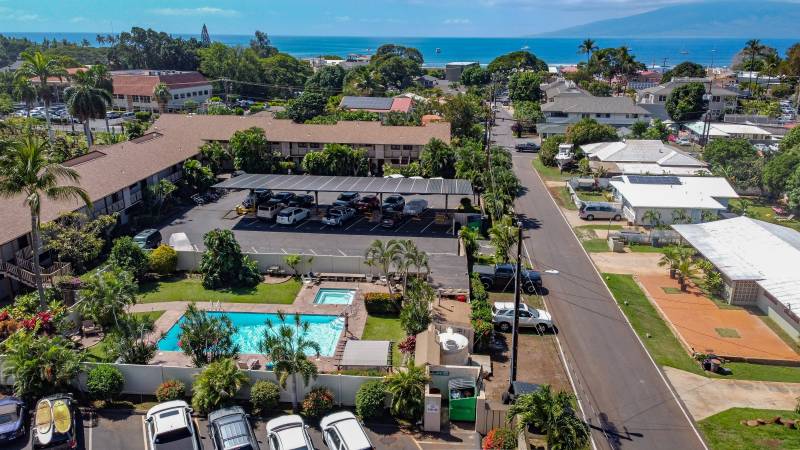
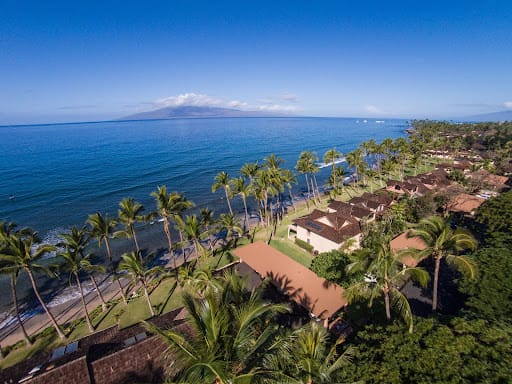
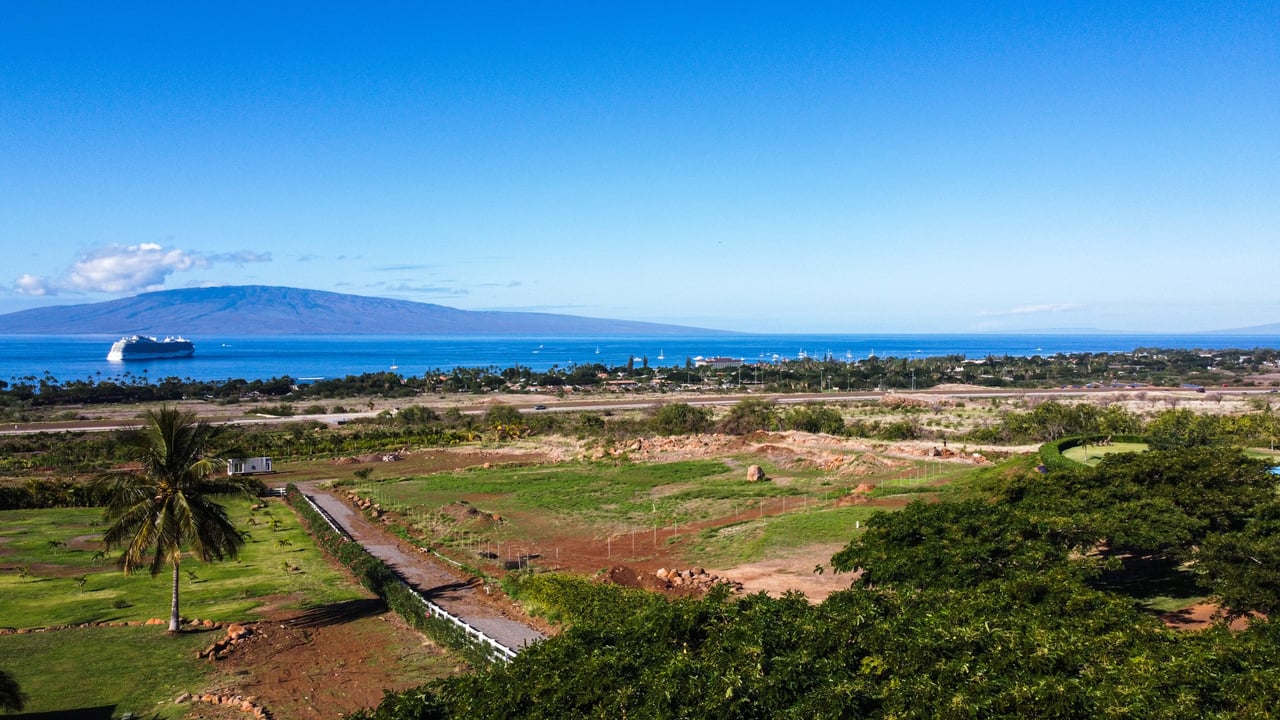
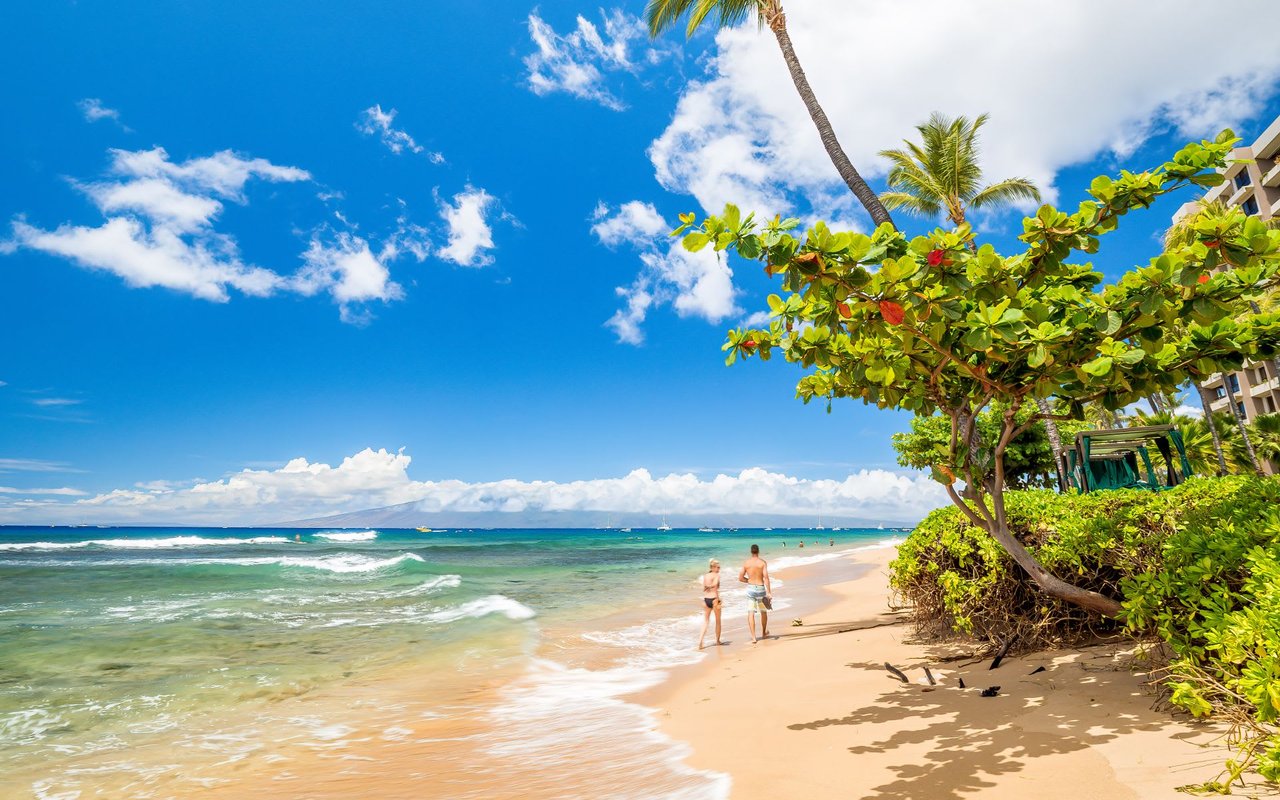
It seems like when it came to anything I wrote regarding Puamana earlier this year the stories and headlines were very much the same, with over sensationalized themes that referenced HEAVY HEAT such as, Hot Tamale! Puamana is Sizzling or Holy Moly: Puamana Sales on Fire. Well, as 2017 comes to an end and while the year as a whole was quite optimistic from a value standpoint, it looks like Puamana – Lahaina’s gold coast gem of a property has simmered down to a smaller, but still warm campfire for the moment (just the way we like it).

Things to Know for 2017 (and for 2018)
- Puamana has had 10 sales through 11/28, 8 prior to June 1st. Historically, this gated oceanfront community averages just over 11 sales annually.
- 7 of those units were 2-bedroom, 3 units were 3-bedroom and 2 were oceanfront
- Units sold for an average of 95% of list price, $862/sq ft or an average sale price of $1.067M
- Average Days on Market was 114 days
- Only 3 units are currently active on the MLS (low inventory)
2017 Puamana Sales


For Perspective
This is the where are we now part. As the first graph above shows, Puamana’s 2017 average sales price of $1.067M equals 73% of the average sales price from 2008 when the 6 units that sold did so for an average price of $1.467M (2008 being the astronomical high of the Maui market). And currently, we are in the rough vicinity of that era as 2017 prices are approximately 94% of the average price values from 2005-2007. How is the real estate market you ask?
Currently – there are 3 active listings for sale and 1 pending under contract. This time last year – Inventory was abnormally high with 11 active listings. Plus we hadn’t seen but 1 sale since July and the election hangover thing was in full effect. This time 5 years ago – the average sale price in Puamana was $815K.
Oceanfront Sales
As I said earlier, 2 lucky Buyers scored oceanfront units in 2017 and did so at an average sale price of $1.775M or $1300/sq ft. Historically 3 sell per year and comparatively speaking, Puamana’s price per square foot price competes (as strong) with other premium Kaanapali & Kapalua luxury oceanfront vacation resorts. And just think many of these $1200/sq. ft. Puamana units are then knocked all the way down to the slab in order to rebuild/remodel.