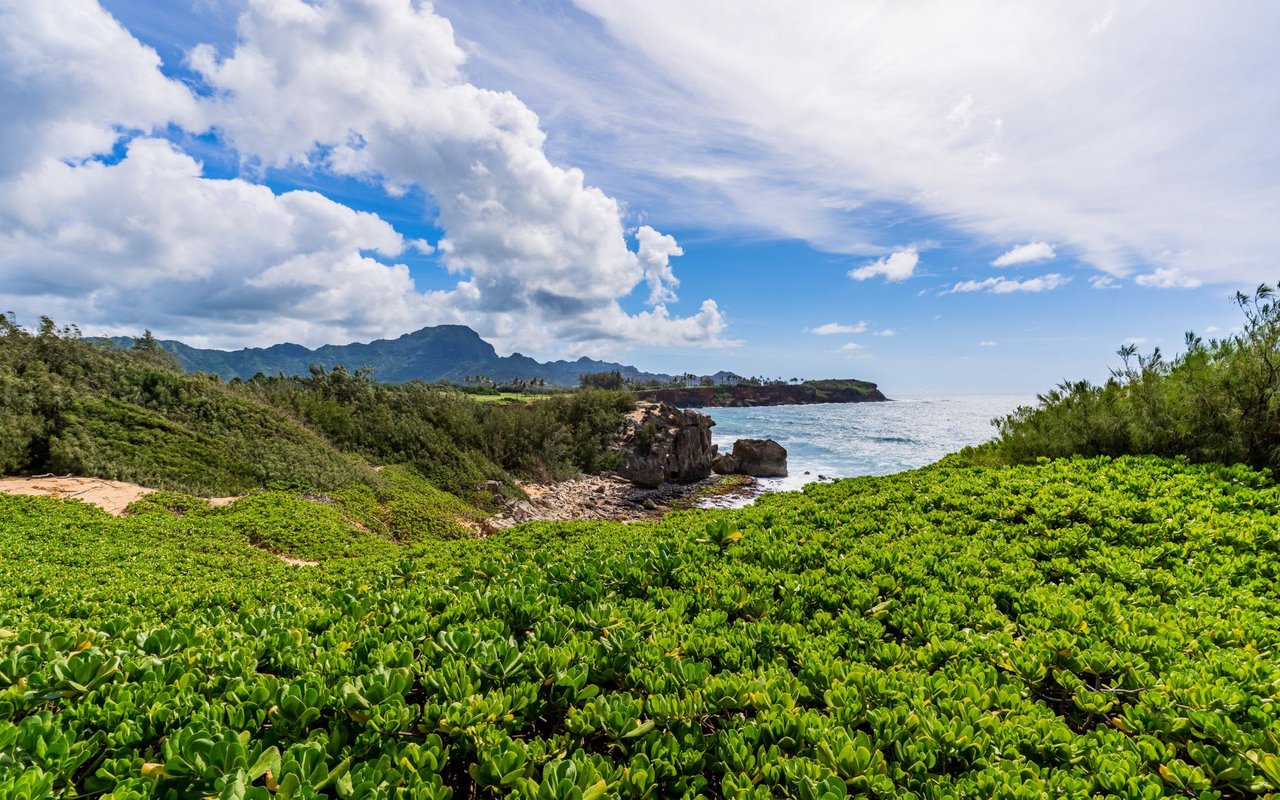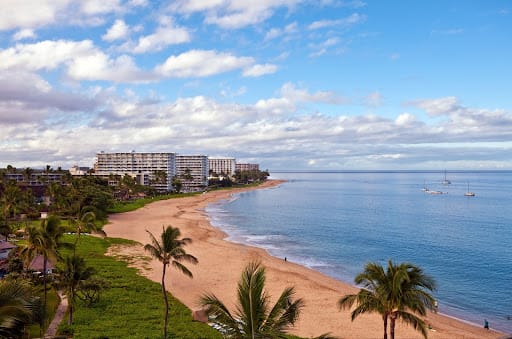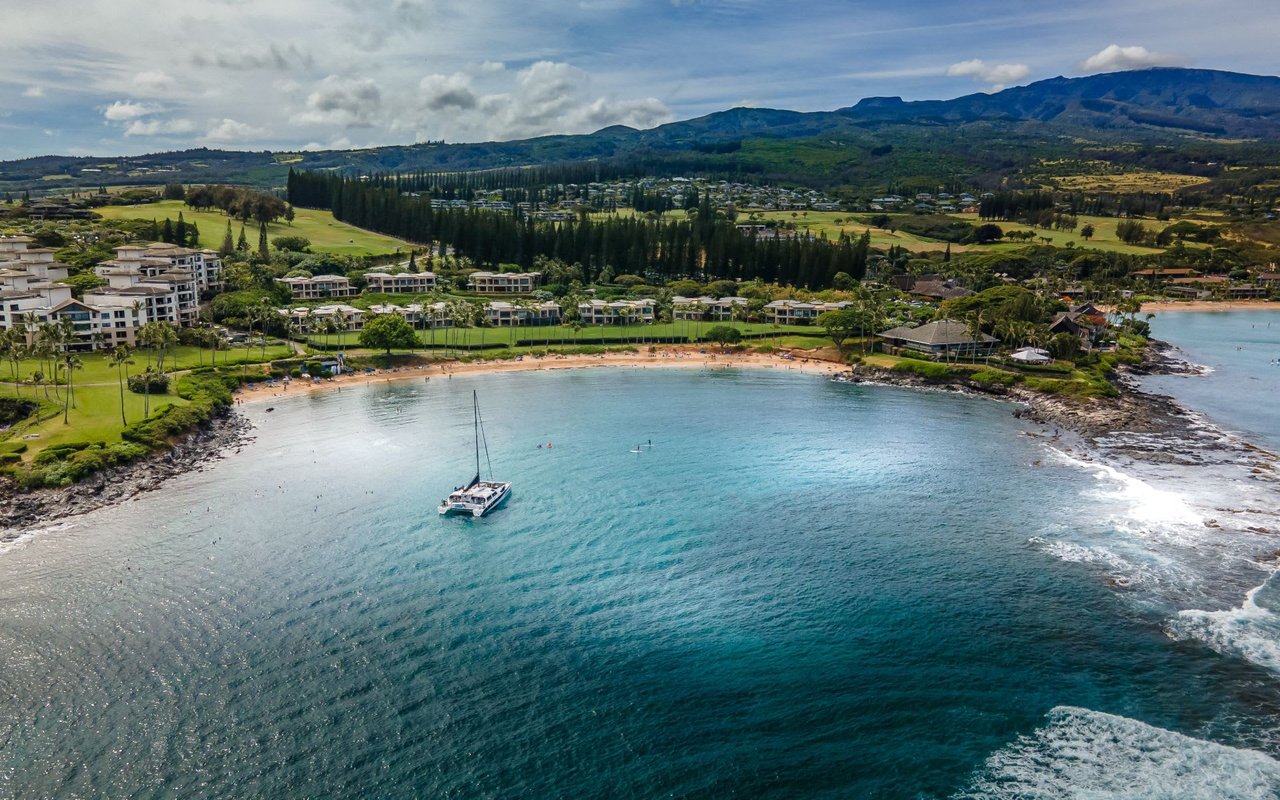
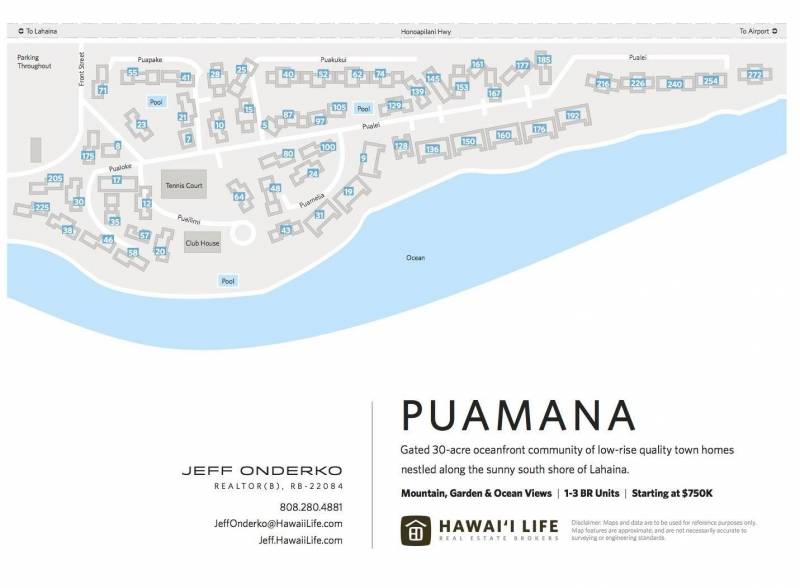
As part of my commitment to keeping the community informed about West Maui’s dynamic, micro-market real estate environment, I’m bringing you an up-to-date, comprehensive property market summary of Puamana, Lahaina’s gold coast oceanfront gated community.


What You’ll Find
- Actual Sales Prices: learn exactly how much specific properties sold for
- Sales Volume: see the strength of the market in terms of how many properties sold
- Days on Market: understand how long it takes the average property to sell
- List Price vs. Sold Price: see how the final sales price compares to the listing price
- Price Per Square Foot: which is critical in calculating real estate values
- Asset % Growth: what is the year over year appreciation of my property
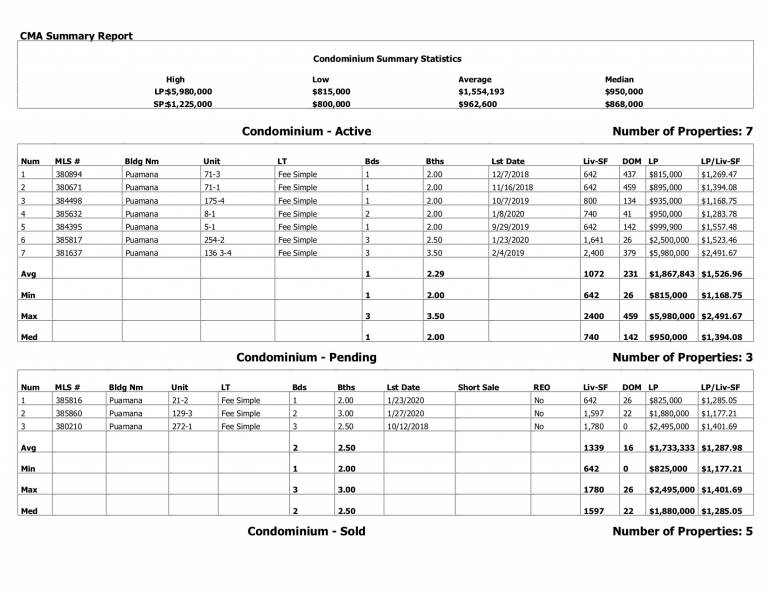
- Current Inventory: what is actively for sale and currently under contract
Before we dig into the numbers, make sure you subscribe to my blog if you want to be notified of future market reports as they come available.
Puamana 2019/2020 | Market Headlines
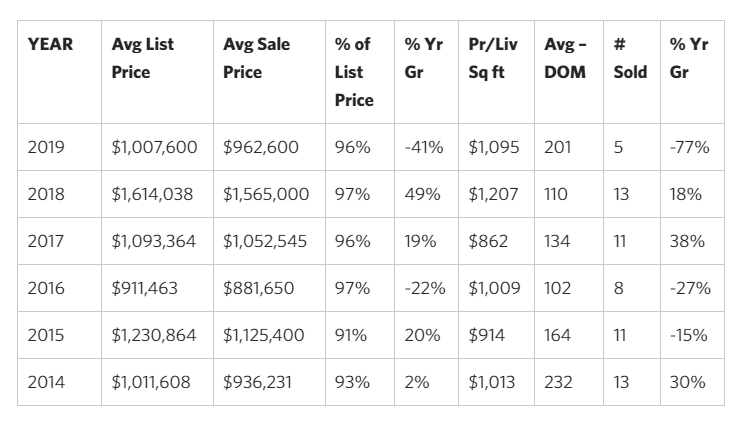
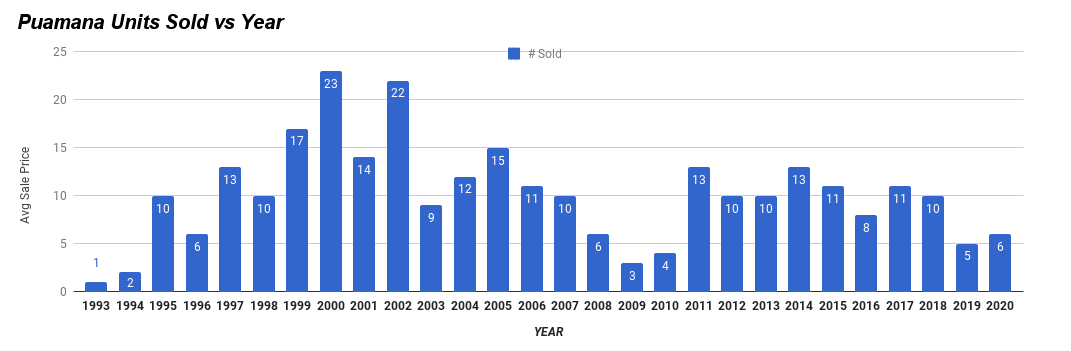
- 5 Puamana sales in 2019, (-58%) from 12 last year and the lowest total since 2010.
- Avg Sales Price = $962K (-41%)
- 1 Bedroom Non Oceanfront unit avg sales price = $831/K (-13%)
- While on the surface it may appear that 2019 sales prices are down significantly from 2018, it’s not necessarily the story at all. Comparatively speaking, 2018 had some incredible $3M+ oceanfront sales that just so happened to be larger 3-bedroom end units. The perfect storm to set gaudy records — end unit desirability, oceanfront location and tremendous demand.
- So while top end prices are lower, we are still sitting at the strongest price/sq foot sales period Puamana has ever seen.
- Additionally, I would point out that the decline in the number of sales this year is due to the very limited inventory offering versus a decline in demand. Yes days on market did increase by nearly 100 days, but I’d claim that was due to the inventory offered. For reference – In 2018, 20 properties went actively listed on the market. In all of 2019 – only 6.
- Currently, there are 7 actively listed units available for sale priced $815K – $6M and 3 under contract.
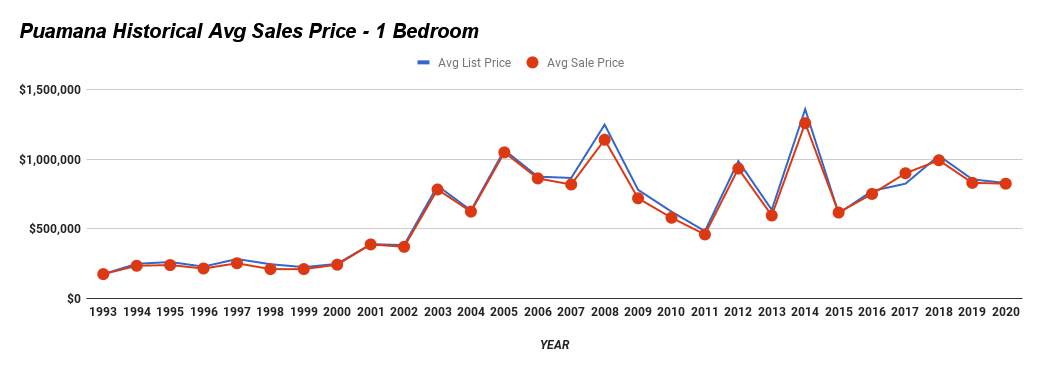
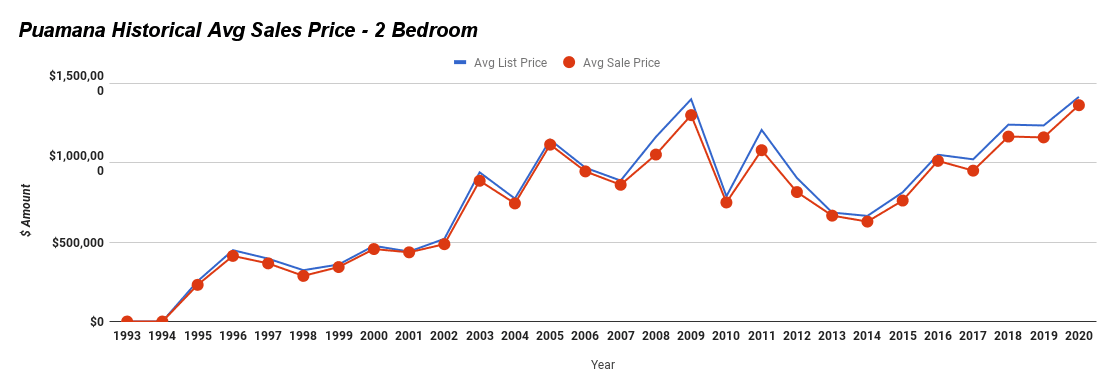
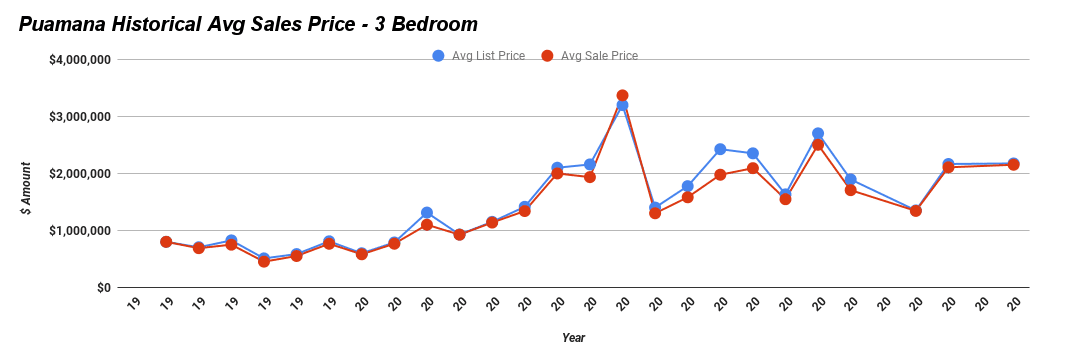
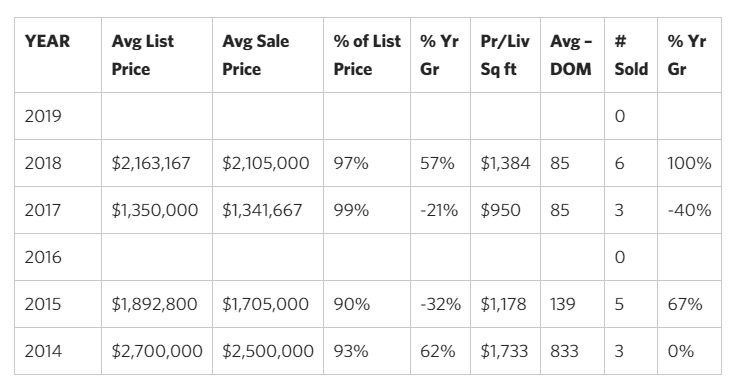
Historical Sales Analysis
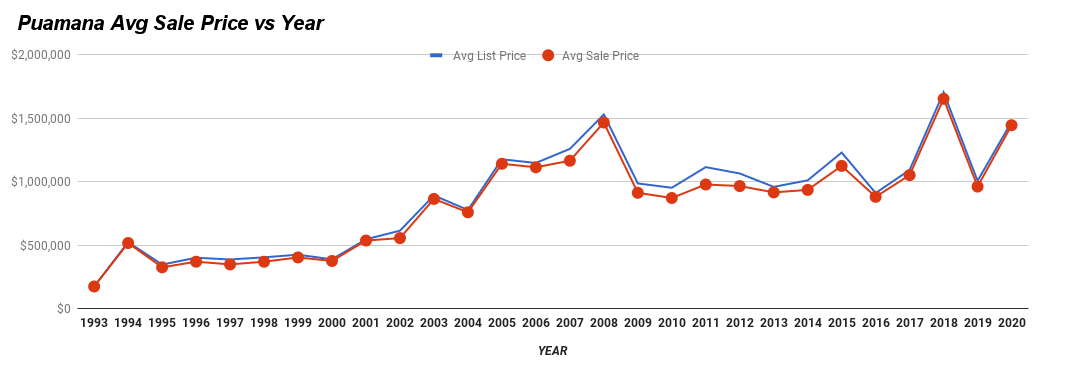
While 2019 sales prices may significantly look down, it’s necessarily not the case as Puamana had multiple large oceanfront sales in 2018. None in 2019.
Puamana Historical Sales Detail